Stimulsoft company blog
In the Stimulsoft blog you'll find useful articles that describe functional features of the products for creating reports and dashboards, the latest company news, thematic series of notes and a lot of other useful information.Featured reading

Simplified Ribbon
Today, we will discuss one important innovation in the Stimulsoft Reports, Dashboards, and Forms...
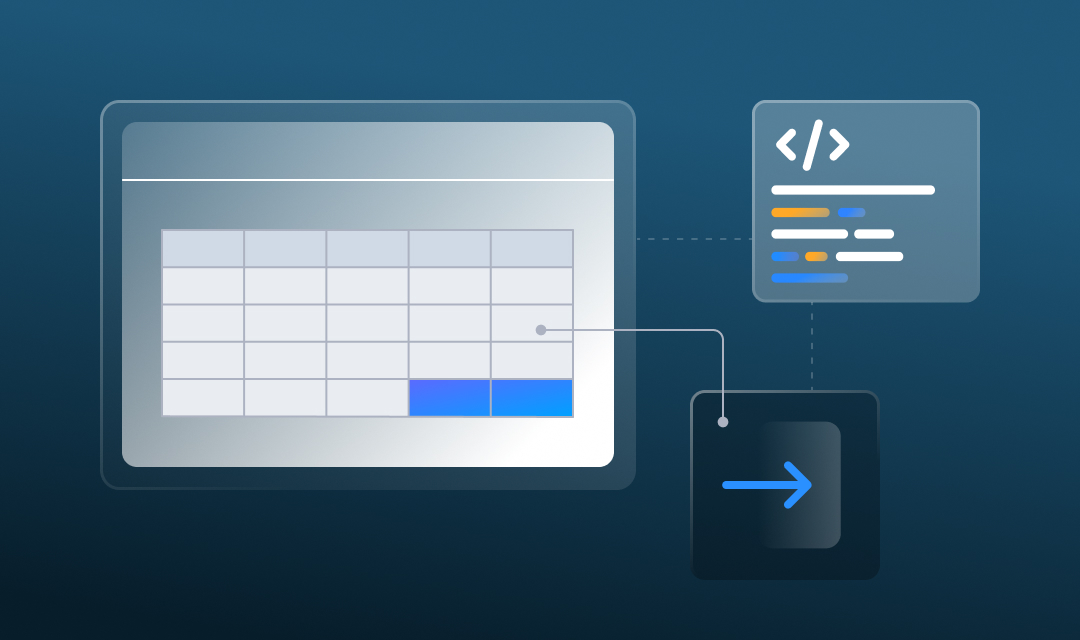
Exporting a dashboard from code
Today, we will analyze in detail the process of exporting a dashboard and its elements from code.

Working with updated products for PHP
One of the main enhancements in version 2023.1 is a significant update in our Reports.PHP and...

Stimulsoft BI Server. Administration.
In this article, let's take a closer look at the issues concerning server administration.

The GraphQL data adapter in Stimulsoft reporting tools
We continue to tell you about the Stimulsoft 2022.3 version and its new features.
November 2022

The license key stopped working. How to solve the issue?
We have collected several non-trivial reasons why the key may not work.

Creating an e-invoice for Germany, France, and Switzerland
Today you'll learn about e-invoices.

The Maxicode in Stimulsoft reports
In this article we will describe the Maxicode barcode in detail.
October 2022

The Text element in dashboards
This time we will tell you about the Text element.

Elements of data filtering in dashboards
Today we’re going to take a detailed look at the dashboard filtering elements from the Filter group.
Stimulsoft BI Server. Administration.
In this article, let's take a closer look at the issues concerning server administration.

The QR code in Stimulsoft reports
Today we’re going to take a closer look at perhaps the most common and popular barcode in the world - the QR code.
September 2022

Image as dashboard element
This time, we’re going to tell you about the Image element.
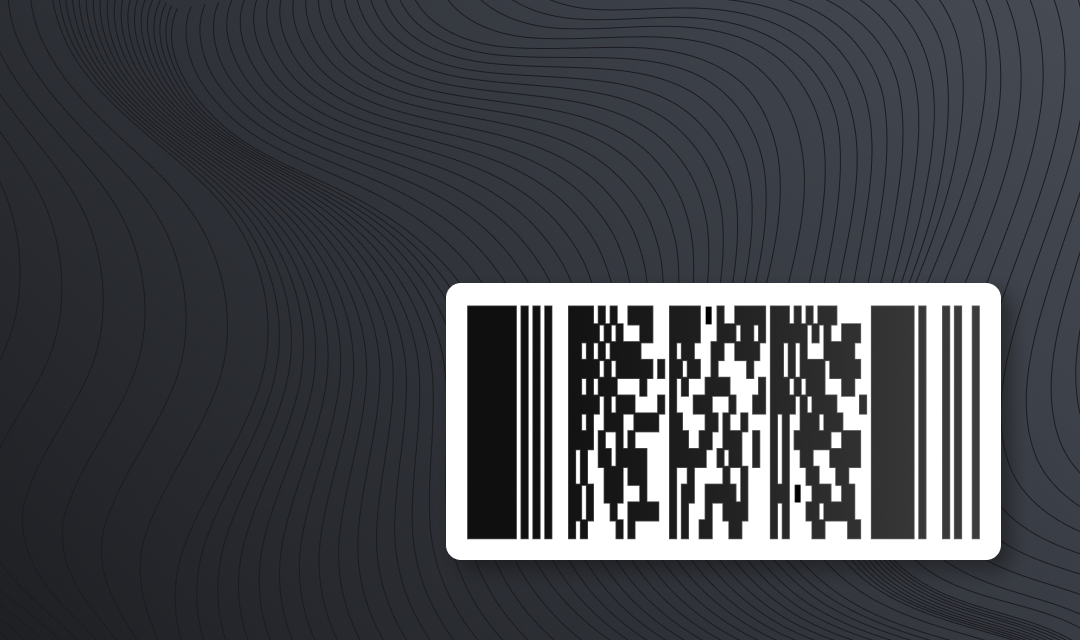
The PDF417 barcode in Stimulsoft reports
The last article was about the Data Matrix barcode, and in this article, we’re going to describe the PDF417 barcode.
New features of the Pivot Table
In this article, we’ll tell you about the Pivot Table element features that have become available since the 2022.3 version.
August 2022
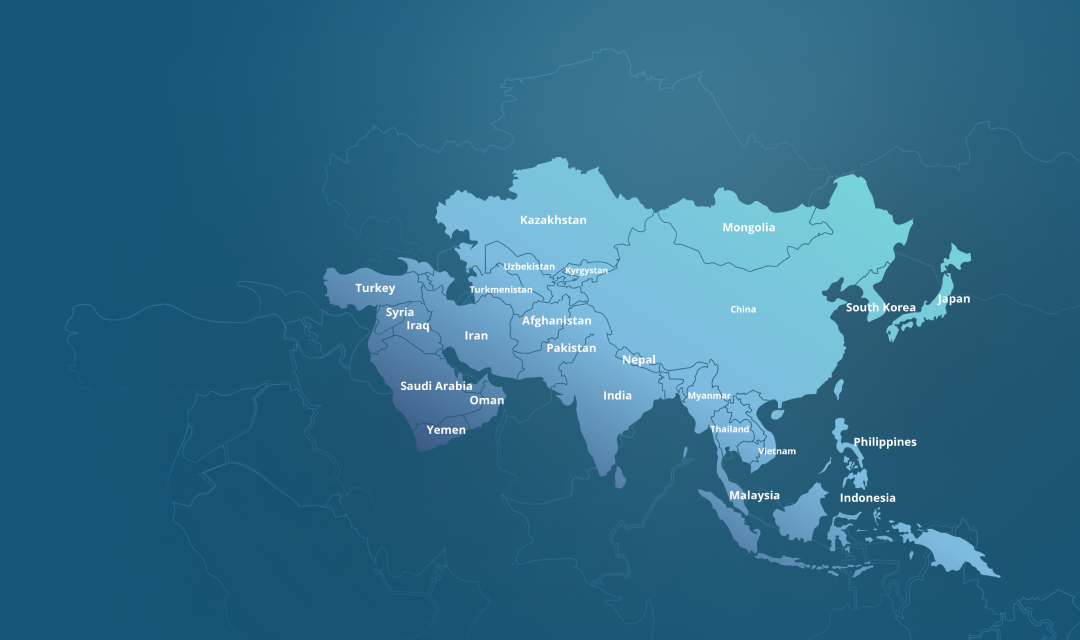
Region map in dashboards
Today, you’ll learn about the Region map element, its basic features, ways of data analysis, and its use in dashboards.

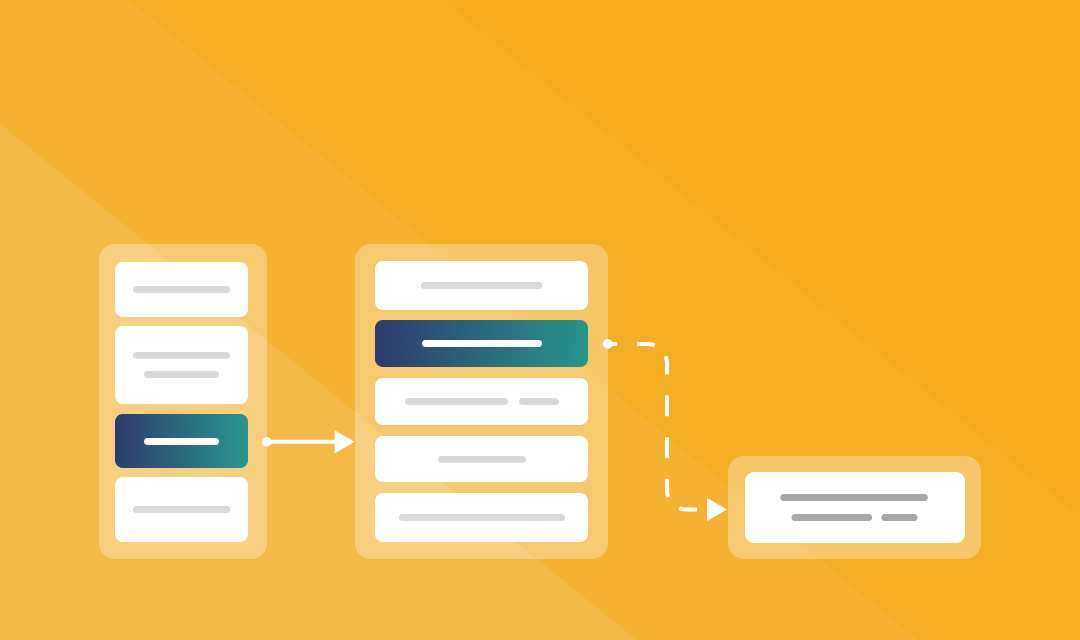
Using a Stored Procedure in the design of reports
When creating reports or dashboards, a Stored Procedure is often used to get data.
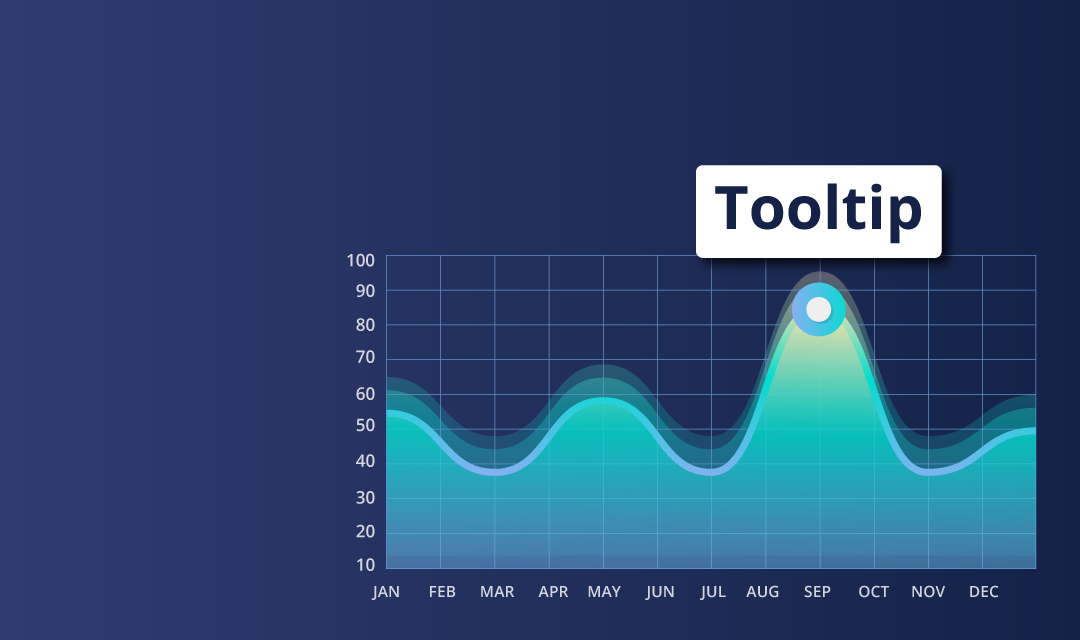
New features for the Tooltip
One of the new features of the 2022.3 release is the ability of advanced settings for tooltips design when hovering.

The DataMatrix Barcode in Stimulsoft reports
We are starting a series of articles about two-dimensional barcodes and how to use them in the reports created in Stimulsoft tools.

The Pivot Table element in dashboards
This time, we’re going to tell you about the Pivot Table.