
Stimulsoft Dashboards.PYTHON
Data visualization in Python applications
Introducing Dashboards.PYTHON - a fast and powerful tool for creating analytical dashboards in services and projects written in Python. The product includes a JavaScript data processing engine, a designer component for creating dashboards, and a fully interactive viewer for viewing ready-made dashboards on the screen of any device.Creating dashboards
The dashboard designer is a key tool in our product, serving as an editor for creating dashboard layouts. Users can connect data from various sources, further structure it using grouping and sorting features, and apply visual design elements.The dashboard designer is available as a standalone Designer application for installation and working on Windows, macOS, and Linux operating systems. Additionally, it is accessible as an online service at designer.stimulsoft.com, offering the same functionality. Explore either the desktop or web version of the tool to familiarize yourself with the designer and its integration into your applications.
Data for dashboards
One of the key advantages of our product is the variety of data available for creating analytical dashboards within your application. We offer support for a wide range of data servers, including MS SQL, Firebird, MySQL, PostgreSQL, among others. Additionally, you can access data from XML, JSON, Excel, and other file sources.
Diverse selection of widgets
There are a lot of elements for creating and editing dashboards, from shapes to buttons, that execute various scripts. Check out the variety of Stimulsoft Dashboards features.
Event handler
An event handler is a functionality designed to simplify the entire sequence of working with data between the client and the server. Stimulsoft Dashboards.PYTHON is a client-server system wherein a JavaScript component operates on the client side, and a Python server is responsible for data management. With the event handler, you can automate the processes of transferring data from the client side to the server side, processing it, and transferring it back using just a few lines of code. The event handler executes all actions on both the client and the server and also provides functionality for complete control over them.Dashboard visualization
The most crucial stage of working with data is their visualization. For this task, the Dashboards.PYTHON product utilizes a special tool - a viewer designed to display ready-made dashboards in Python applications. The dashboard viewer is fully customizable, fast, and user-friendly. To ensure integration into projects, we offer a variety of design themes and options for customizing the application's appearance and functionality.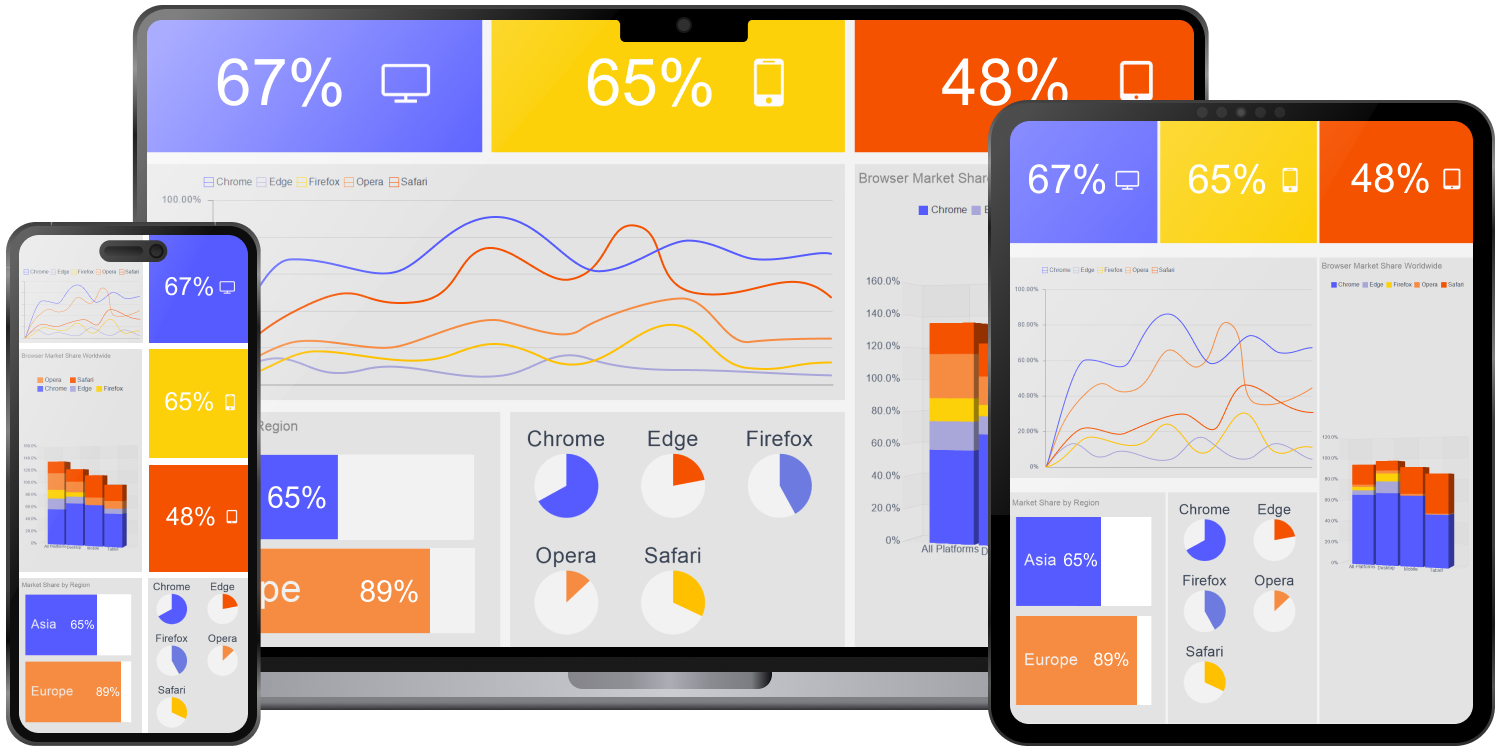
The viewer supports interactive elements, full-screen viewing of both the entire dashboard and its individual components, and conversion of the analytical panel to PDF, Excel, and HTML formats. The component provides over 40 UI localizations, mobile and desktop workspaces, elements that support animation for visual assessment of changes, and for user convenience, currently unused controls are automatically removed from the panel.
Integration
We aimed to develop a product for the simplest integration of a JavaScript data analytics tool into any Python web projects. Special functions have been incorporated to facilitate integration into projects utilizing popular web frameworks such as Django, Flask, and Tornado. To enable full functionality of the components, simply install the Python package and add a few lines of code to the project; all HTML and JS code will be deployed automatically. Django
 Flask
Flask Tornado
Creating reports with AI
The AI assistant, powered by a generative AI model, is integrated into the report and dashboard designer. AI is designed to verify, generate, explain, and optimize connection strings for data sources, validate and convert event scripts, ensure the correct execution of function scripts, and more.
Stimulsoft Ultimate
Stimulsoft Dashboards.PYTHON is part of Stimulsoft Ultimate, a comprehensive All-in-One set of products designed for working with data on all modern platforms such as .NET, ASP.NET, JavaScript, Java, PHP, Blazor, Angular, WPF, WinForms, Avalonia UI, Python, and others. With our components, you can create, print, export complex reports, analyze data using clear and colorful dashboards, and collect data from users through interactive forms.What's next?
We have prepared hundreds of reports and dashboards templates grouped by spheres of use. You can immediately use them by connecting your data or change according to your requirements. Our lessons and technical documentation will help make your work effective! Moreover, you can request the training courses from our technical specialists, subscribe to our YouTube channel to always get new videos, and receive all your answers in our online documentation.
Training courses
Are you faced with difficulties when creating reports and dashboards? This is not a problem!
Video lessons
We have prepared many video materials for the designing reports and dashboards. All tutorials are grouped by specific topics and regularly updated and supplemented.
Documentation
Our online user guides describe both the general functionality of the product and provide advice and suggestions for the report design and hints of setting components for reporting.