























Stimulsoft Reports
Reporting tool for Avalonia
A reporting solution for applications built with Avalonia UI on the .NET platform. The reporting components fully leverage the capabilities of the Avalonia framework, run on all modern operating systems, and meet every requirement for creating professional, high‑quality reports.Professional reports
Explore professional report templates designed for a wide range of business tasks – from sales analysis to official statistics. Each template is a ready‑to‑use solution that can be quickly adapted to your specific data and requirements.Loading...
Installation
Installing the Stimulsoft report generator for Avalonia UI into your project takes just a few minutes. Install the client‑side NuGet package for Avalonia, connect the components, configure the viewer, add a few lines of code — and your application is ready to handle reports with ease. bash
dotnet add package Stimulsoft.Reports.AvaloniaBuilt-in Report Viewing
View reports directly in your application using a flexible viewer component. Users get convenient tools: page navigation, zoom, filtering, and interactive data drill‑down. The viewer performs quickly even with large datasets and adapts seamlessly to any device.<Window xmlns="https://github.com/avaloniaui"
xmlns:x="http://schemas.microsoft.com/winfx/2006/xaml"
xmlns:d="http://schemas.microsoft.com/expression/blend/2008"
xmlns:mc="http://schemas.openxmlformats.org/markup-compatibility/2006"
xmlns:viewer="using:Stimulsoft.Report.Viewer.Avalonia.Viewer"
x:Class="AvaloniaApplication.Views.MainWindow"
mc:Ignorable="d" d:DesignWidth="1400" d:DesignHeight="800"
Width="1400" Height="800">
<viewer:StiViewerControl x:Name="viewerControl" />
</Window>namespace AvaloniaApplication.Views;
public partial class MainWindow : Avalonia.Controls.Window
{
public MainWindow()
{
InitializeComponent();
var report = Stimulsoft.Report.StiReport.CreateNewReport();
report.Load("Reports\\Report.mrt");
viewerControl.Report = report;
}
}Flexible Report Export
Export reports to the most widely used formats: PDF, Excel, Word, HTML, CSV, JSON, XML, and more. All export tools are available directly in the viewer interface or through your application's API. You can customize export settings – select pages, orientation, image quality, and data compression – while keeping the report's structure, styles, and interactive elements fully intact, ensuring the output matches the original document with precision. MainWindow.axaml.cs
using Avalonia.Platform;
using Stimulsoft.Report;
using Stimulsoft.Report.Viewer.Avalonia.Viewer;

private async void ButtonExport_Click(object sender, RoutedEventArgs e)
{
    var report = new StiReport();
    report.Load(AssetLoader.Open(new Uri("avares://ReportsApp/Reports/MasterDetail.mrt")));
    report.CalculationMode = StiCalculationMode.Interpretation;
    report.RenderWithWpf(false);

    await StiViewerControl.ExportPdfAsync(report);
    await StiViewerControl.ExportExcelAsync(report);
    await StiViewerControl.ExportHtmlAsync(report);
}


Report designer: desktop and online
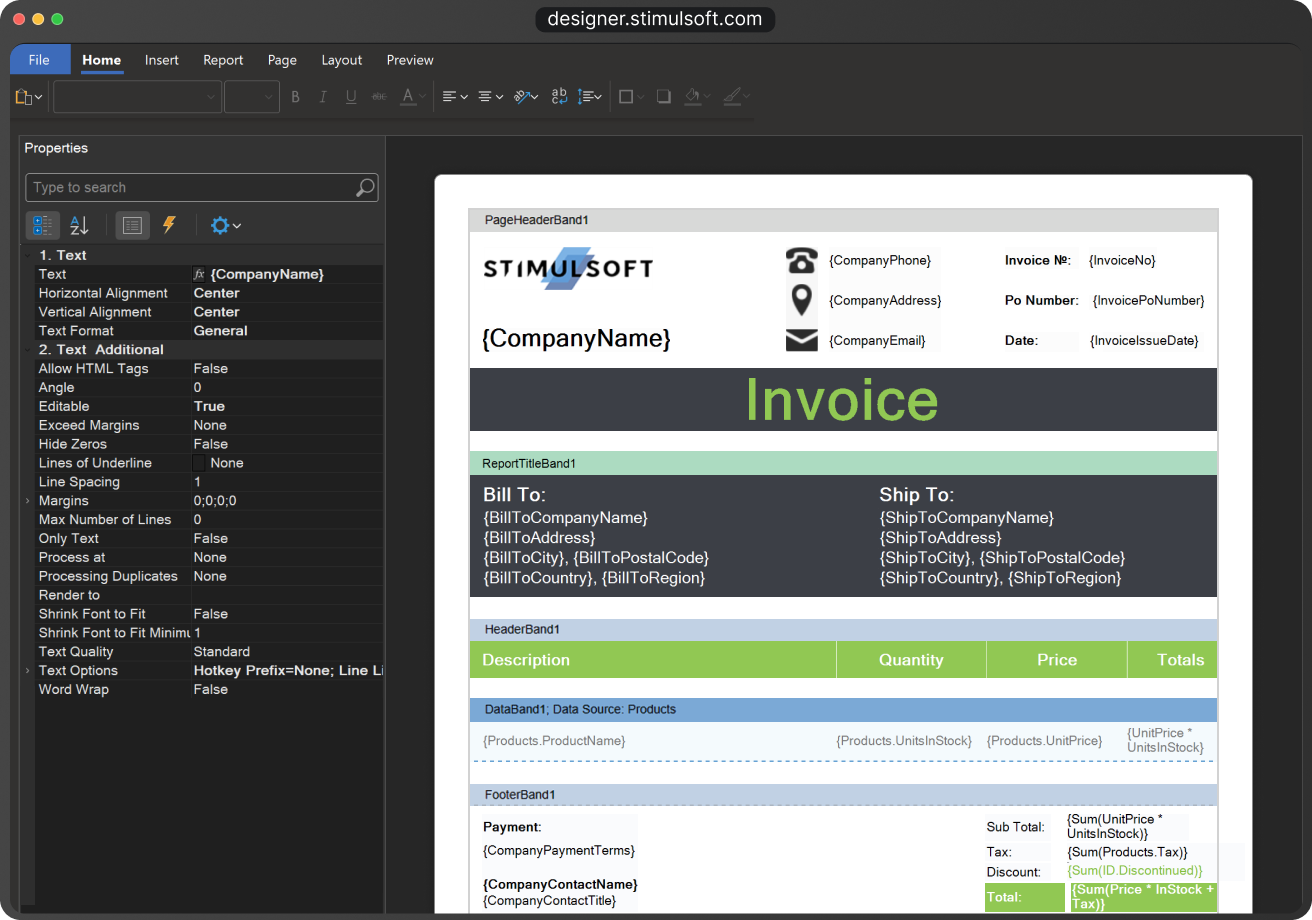
The Stimulsoft Designer is a powerful tool for visually creating reports, dashboards, and PDF forms. It is available in two formats: as a standalone desktop application for Windows, macOS, and Linux and online via the browser at designer.stimulsoft.com.Connect data from any source – SQL, NoSQL, cloud storage, file systems, and more. Use over 80 chart types, including 3D visualization, built‑in barcodes, interactive elements, events, and much more. Ready‑made templates and wizards help you get started quickly, while flexible settings let you adapt reports to any business need.



Stimulsoft
Ultimate
Stimulsoft Reports for Avalonia is part of Stimulsoft Ultimate – a comprehensive set of analytics and data visualization components for all modern platforms: .NET, ASP.NET, JavaScript, Java, PHP, Blazor, Angular, WPF, WinForms, Avalonia UI, Python, and more.What's next?
We have prepared hundreds of reports and dashboards templates grouped by spheres of use. You can immediately use them by connecting your data or change according to your requirements. Our lessons and technical documentation will help make your work effective! Moreover, you can request the training courses from our technical specialists, subscribe to our YouTube channel to always get new videos, and receive all your answers in our online documentation.
Training courses
Are you faced with difficulties when creating reports and dashboards? This is not a problem!
Video lessons
We have prepared many video materials for the designing reports and dashboards. All tutorials are grouped by specific topics and regularly updated and supplemented.
Documentation
Our online user guides describe both the general functionality of the product and provide advice and suggestions for the report design and hints of setting components for reporting.