























Stimulsoft Reports
Reporting tool for Angular
A report generator built specifically for the Angular framework. The client-side is fully compatible with all actively supported Angular versions and provides everything you need to create, edit, view, and export reports. The server-side leverages .NET Framework 4.7.2, .NET 6, .NET 8, .NET 10, and Java.Angular-Native Reporting
Create professional reports and dashboards for your Angular applications. The flexible Stimulsoft generator enables data visualization, calculations, grouping and sorting, as well as custom document styling.Loading...
Client-side installation
Quick start in just a couple of minutes and only a few lines of code. Download the npm packages and easily integrate an Angular report generator into your application. Create, view, and export interactive reports using a powerful report designer and data visualization components. bash
npm install stimulsoft-viewer-angular
npm install stimulsoft-designer-angularServer-side installation
Quick server-side setup for your application. Install the required package and add a few lines of code to configure the controller. The server-side is built on ASP.NET MVC, .NET or Java, and provides full reporting engine functionality. bash
dotnet add package Stimulsoft.Reports.AngularHow to view
Embed ready-made reports directly into your Angular application using a dedicated viewer. This component fully integrates into the framework's ecosystem, ensuring fast and convenient document display without page reloads. Users get access to interactive viewing, content search, and zoom – all within a single interface that naturally fits your application for efficient reporting and data visualization. app.component.html
<stimulsoft-viewer-angular
  [requestUrl]="'http://localhost:60801/Viewer/{action}'"
  [action]="'InitViewer'"
  [height]="'100vh'">
</stimulsoft-viewer-angular>
How to export
Export ready-made reports to the most widely used formats: PDF, Excel, Word, HTML, CSV, XML, JSON, RTF, OpenDocument, and text files. Flexible export tools built into Stimulsoft Angular components make it easy to integrate data export into any business process. Configure export settings – page selection, orientation, compression – and get the result you need with minimal effort. app.component.html
<input
  type="button"
  (click)="viewer.api.export('Pdf', { ImageResolution: 200 })"
  value="Export to PDF"
/>

<stimulsoft-viewer-angular
  #viewer
  [requestUrl]="'http://localhost:60801/Viewer/{action}'"
  [action]="'InitViewer'"
  [height]="'100vh'">
</stimulsoft-viewer-angular>


How to design
Reports from code — simplicity in every detail. Integrate report generation into your application: use familiar C# or JavaScript to connect data, configure layouts, and export results to PDF, Excel, Word, and other formats. app.component.html
<stimulsoft-designer-angular
  #designer
  *ngIf="!showViewer"
  [requestUrl]="'http://localhost:60801/api/designer'"
  [height]="'100%'"
  [width]="'100%'"
  (designerLoaded)="this.designer.designerEl.nativeElement.style.height='100%'">
  Loading designer...
</stimulsoft-designer-angular>
Server-Side Report Processing on ASP.NET or Java
The Stimulsoft server-side component for Angular is built on the .NET Framework, .NET, and Java platform and runs on Windows, macOS, and Linux. All resource-intensive tasks – template loading, rendering, calculations, and export to various formats – are offloaded to the server, which eases the client-side load and boosts overall application performance. The solution supports .NET Framework 4.7.2, .NET 6, .NET 8, .NET 10, and Java 8+, including both plain Java applications and the Spring Boot framework, ensuring stable operation in modern enterprise environments. ViewerController.cs
using Microsoft.AspNetCore.Mvc;
using Stimulsoft.Report;
using Stimulsoft.Report.Angular;

namespace Integrating_the_Report_Viewer_into_an_Application.Controllers
{
    [Controller]
    public class ViewerController : Controller
    {
        static ViewerController()
        {
            // How to Activate
            //Stimulsoft.Base.StiLicense.Key = "6vJhGtLLLz2GNviWmUTrhSqnO...";
            //Stimulsoft.Base.StiLicense.LoadFromFile("license.key");
            //Stimulsoft.Base.StiLicense.LoadFromStream(stream);
        }

        [HttpPost]
        public IActionResult InitViewer()
        {
            var requestParams = StiAngularViewer.GetRequestParams(this);

            var options = new StiAngularViewerOptions();
            options.Actions.GetReport = "GetReport";
            options.Actions.ViewerEvent = "ViewerEvent";
            options.Appearance.ScrollbarsMode = true;

            return StiAngularViewer.ViewerDataResult(requestParams, options);
        }

        [HttpPost]
        public IActionResult GetReport()
        {
            var report = StiReport.CreateNewReport();
            var path = StiAngularHelper.MapPath(this, $"Reports/MasterDetail.mrt");
            report.Load(path);

            return StiAngularViewer.GetReportResult(this, report);
        }

        [HttpPost]
        public IActionResult ViewerEvent()
        {
            return StiAngularViewer.ViewerEventResult(this);
        }
    }
}
package com.stimulsoft.demo;
import java.io.File;
import java.io.IOException;
import javax.servlet.ServletException;
import javax.servlet.http.HttpServlet;
import javax.servlet.http.HttpServletRequest;
import javax.servlet.http.HttpServletResponse;
import com.stimulsoft.base.json.JSONObject;
import com.stimulsoft.base.mail.StiMailProperties;
import com.stimulsoft.report.StiReport;
import com.stimulsoft.report.StiSerializeManager;
import com.stimulsoft.web.proxyee.StiHttpServletRequest;
import com.stimulsoft.web.proxyee.StiHttpServletResponse;
import com.stimulsoft.webviewer.StiAngularViewerHandler;
import com.stimulsoft.webviewer.StiWebViewerOptions;
import com.stimulsoft.webviewer.servlet.StiWebViewerActionServletHelper;
public class StiAngularViewerActionServlet extends HttpServlet implements StiAngularViewerHandler {
private static final long serialVersionUID = 2759116620736251447L;
protected void doGet(HttpServletRequest request, HttpServletResponse response) throws ServletException, IOException {
processing(request, response);
}
protected void doPost(HttpServletRequest request, HttpServletResponse response) throws ServletException, IOException {
processing(request, response);
}
protected void processing(HttpServletRequest request, HttpServletResponse response) {
StiWebViewerActionServletHelper.processing(new StiHttpServletRequest(request, this), new StiHttpServletResponse(response));
}
public StiWebViewerOptions getOptions(StiHttpServletRequest request, StiHttpServletResponse response) {
StiWebViewerOptions options = new StiWebViewerOptions();
options.getAppearance().setScrollbarsMode(true);
return options;
}
public StiReport getReport(StiHttpServletRequest request, StiHttpServletResponse response, JSONObject viewerProperties) {
try {
File reportFile = new File(request.getSession().getServletContext().getRealPath("reports\\" + viewerProperties.getString("reportName")));
StiReport report = StiSerializeManager.deserializeReport(reportFile);
report.render();
return report;
} catch (Exception e) {
e.printStackTrace();
}
return null;
}
public StiMailProperties getMailProperties(StiHttpServletRequest request, StiHttpServletResponse response) {
StiMailProperties mailProperties = new StiMailProperties();
// fill necessary fields
return mailProperties;
}
}package com.stimulsoft.demo;
import java.io.File;
import javax.servlet.http.HttpServletRequest;
import javax.servlet.http.HttpServletResponse;
import org.springframework.core.io.ClassPathResource;
import org.springframework.web.bind.annotation.RequestMapping;
import org.springframework.web.bind.annotation.RestController;
import com.stimulsoft.base.json.JSONObject;
import com.stimulsoft.base.mail.StiMailProperties;
import com.stimulsoft.report.StiReport;
import com.stimulsoft.report.StiSerializeManager;
import com.stimulsoft.web.proxyee.StiHttpServletRequest;
import com.stimulsoft.web.proxyee.StiHttpServletResponse;
import com.stimulsoft.webviewer.StiAngularViewerHandler;
import com.stimulsoft.webviewer.StiWebViewerOptions;
import com.stimulsoft.webviewer.servlet.StiWebViewerActionServletHelper;
@RestController
public class StiViewerController implements StiAngularViewerHandler {
@RequestMapping("/webviewer/**")
public void StiWebViewer(HttpServletRequest request, HttpServletResponse response) {
StiWebViewerActionServletHelper.processing(new StiHttpServletRequest(request, this), new StiHttpServletResponse(response));
}
public StiWebViewerOptions getOptions(StiHttpServletRequest request, StiHttpServletResponse response) {
StiWebViewerOptions options = new StiWebViewerOptions();
options.getAppearance().setScrollbarsMode(true);
return options;
}
public StiReport getReport(StiHttpServletRequest request, StiHttpServletResponse response, JSONObject viewerProperties) {
try {
File reportFile = new ClassPathResource(viewerProperties.getString("reportName")).getFile();
StiReport report = StiSerializeManager.deserializeReport(reportFile);
report.render();
return report;
} catch (Exception e) {
return null;
}
}
public StiMailProperties getMailProperties(StiHttpServletRequest request, StiHttpServletResponse response) {
StiMailProperties mailProperties = new StiMailProperties();
// fill necessary fields
return mailProperties;
}
}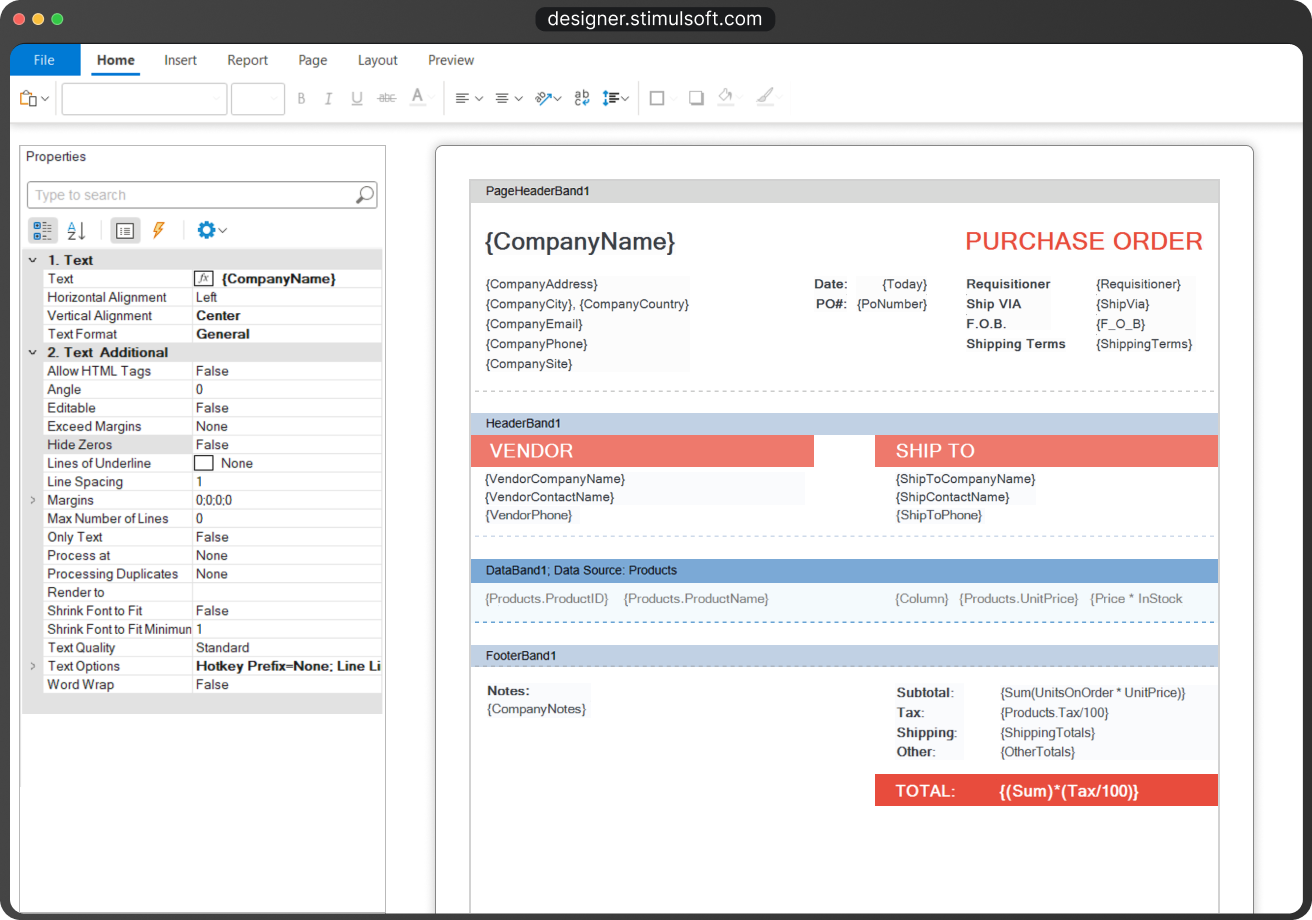
Report, Dashboard, and Form Designer
The Stimulsoft Designer is the primary tool for building professional reporting. Connect data from SQL, OLEDB, ODBC, JSON, XML, and other sources. Use ready-made components – tables, charts, maps – and customize their style with themes, conditional formatting, and individual display settings. The Designer can run as a standalone desktop application, be embedded into your app, or launch directly in the browser — you choose the format that best fits your needs.

Stimulsoft
Reports.WEB
Stimulsoft Reports for Angular is a part of the Stimulsoft Reports.WEB product, a cross-platform set of tools for report creation using ASP.NET, ASP.NET MVC, .NET, Angular, Blazor, React, and Vue.js technologies. It includes a powerful reporting engine using a universal .NET platform, a simple and convenient HTML5 report designer, and an interactive and fast HTML5 report viewer.What's next?
We have prepared hundreds of reports and dashboards templates grouped by spheres of use. You can immediately use them by connecting your data or change according to your requirements. Our lessons and technical documentation will help make your work effective! Moreover, you can request the training courses from our technical specialists, subscribe to our YouTube channel to always get new videos, and receive all your answers in our online documentation.
Training courses
Are you faced with difficulties when creating reports and dashboards? This is not a problem!
Video lessons
We have prepared many video materials for the designing reports and dashboards. All tutorials are grouped by specific topics and regularly updated and supplemented.
Documentation
Our online user guides describe both the general functionality of the product and provide advice and suggestions for the report design and hints of setting components for reporting.