Stimulsoft company blog
In the Stimulsoft blog you'll find useful articles that describe functional features of the products for creating reports and dashboards, the latest company news, thematic series of notes and a lot of other useful information.Featured reading

Stimulsoft Documentation MCP Server
Stimulsoft Documentation MCP Server connects AI assistants directly to the official Stimulsoft...

Simplified Ribbon
Today, we will discuss one important innovation in the Stimulsoft Reports, Dashboards, and Forms...
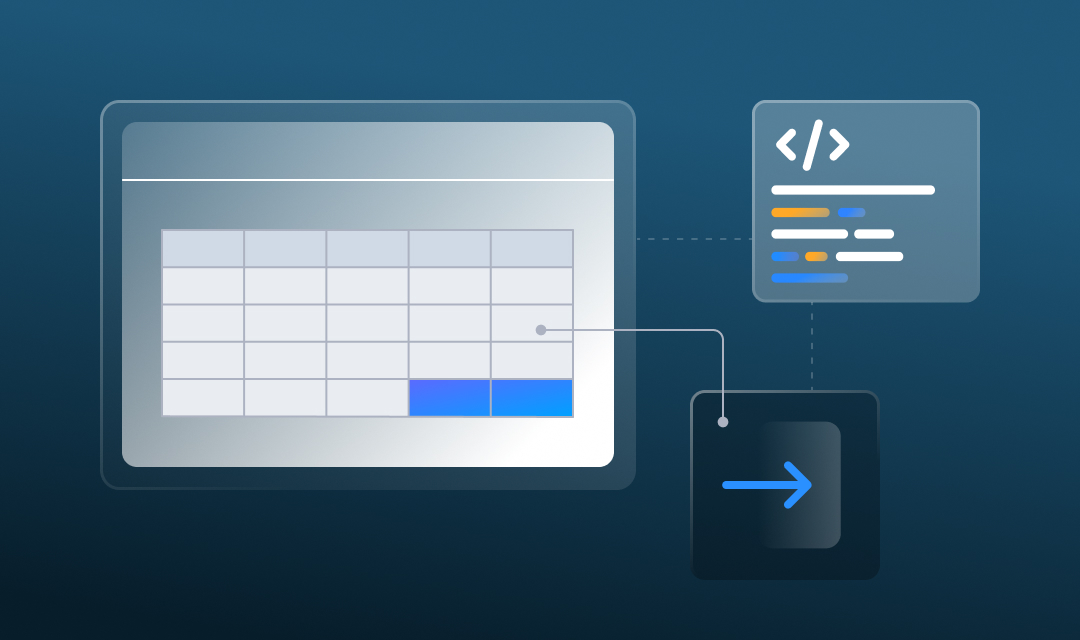
Exporting a dashboard from code
Today, we will analyze in detail the process of exporting a dashboard and its elements from code.
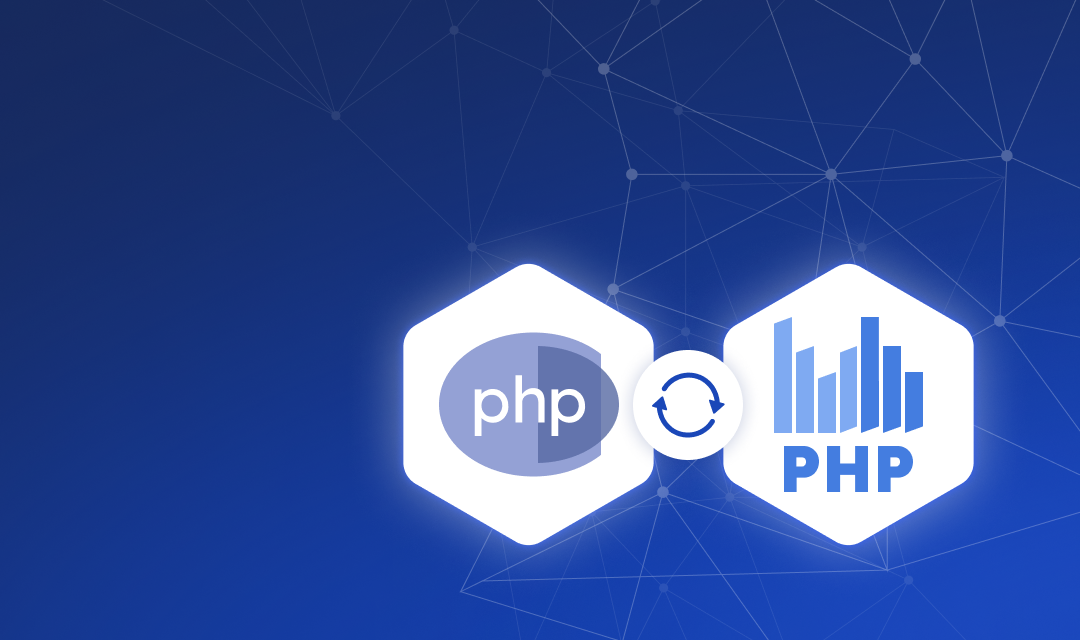
Working with updated products for PHP
One of the main enhancements in version 2023.1 is a significant update in our Reports.PHP and...

Stimulsoft BI Server. Administration.
In this article, let's take a closer look at the issues concerning server administration.
July 2022
The HTML Preview Mode
We continue to acquaint you with new features of the version of Stimulsoft Reports and Dashboards 2022.3. Today we’re going to tell you about the HTML Preview Mode.

The GraphQL data adapter in Stimulsoft reporting tools
We continue to tell you about the Stimulsoft 2022.3 version and its new features.

Applying the Progress element in dashboards
Today you’ll learn about another element – Progress, its basic features and how it is applied in dashboards.
Ribbon chart in Stimulsoft products for creating reports
We start the series of articles about new features of the version of Stimulsoft Reports and Dashboards 2022.3 that was released on June 21, 2022.
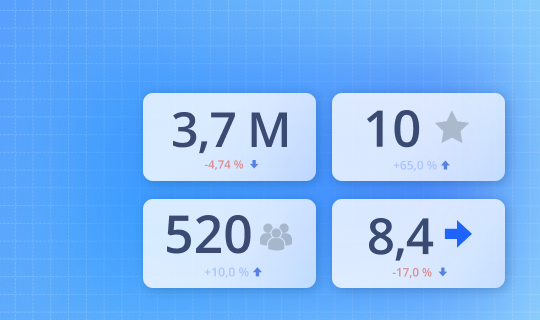
Indicator in dashboards
This time we will tell you in detail about the Indicator element.
June 2022

Online map in dashboards
Now, it’s time to consider the next dashboard element – Online map.

Changing font in reports
Today's article is about changing the text font as one of the options for customizing reports.

Gauges in dashboards
Now we’re going to tell you about the Gauge element.
Parameters in a query
In today’s article, we’re going to tell you about features of data filtering when querying storage and how to reduce time for it, having optimized the process of report and dashboard rendering.
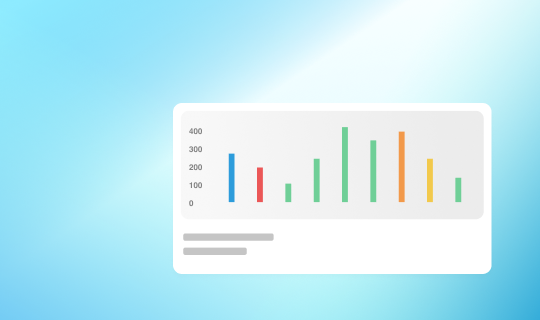
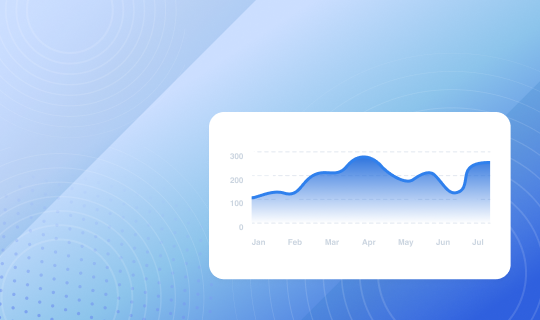
The Chart element in dashboards
We continue the series of articles about visualization and data analytics.
May 2022

Embedding an image into a QR code
In this article, we’d like to remind you about another feature – embedding an image into a QR code.
New features of the Publish wizard
Today, in this article, we’re going to tell you about the new features of the Publish wizard.
Sorting of months
In this article, we are going to tell you about ways of sorting months in dashboards.
Rounding in charts
In this article, let’s look closer at rounding in charts.

Dashboard element Table
This time you will know about the Table element and how to create a dashboard with it.