Stimulsoft company blog
In the Stimulsoft blog you'll find useful articles that describe functional features of the products for creating reports and dashboards, the latest company news, thematic series of notes and a lot of other useful information.Featured reading
News
 24 Apr 2026 · Andrew Savin
 14 Apr 2026 · Tim Crawford
 31 Dec 2025 · Andrew Savin
 18 Dec 2025 · Andrew Savin
 8 Oct 2025 · Andrew Savin
Stimulsoft Reports and Dashboards 2026.2 has been released!
We are excited to announce the release of a new version of Stimulsoft Reports and Dashboards - 2026.
BlogStimulsoft Documentation MCP Server
Stimulsoft Documentation MCP Server connects AI assistants directly to the official Stimulsoft...
NewsOur achievements in 2025
Every year, at Stimulsoft, we highlight the most significant innovations and improvements to our...
NewsStimulsoft Reports and Dashboards 2026.1 released!
We are pleased to announce the release of version 2026.1 of Stimulsoft products for creating...
NewsStimulsoft Reports, Dashboards, and PDF Forms version 2025.4 has been released!
We are honored to announce the release of Stimulsoft software version 2025.4 for creating reports,...
July 2026
Blog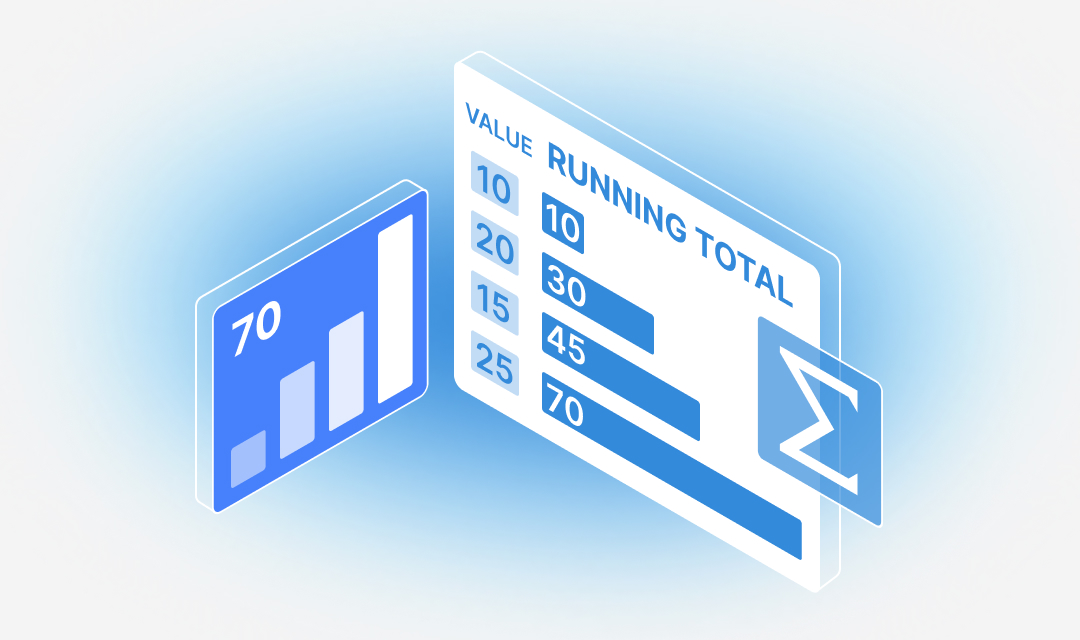
Data transformation. Part 2: Calculating a Running Total
In today’s article, we continue our series on Data Transformation, one of the tools available in the Stimulsoft report designer.
June 2026
Blog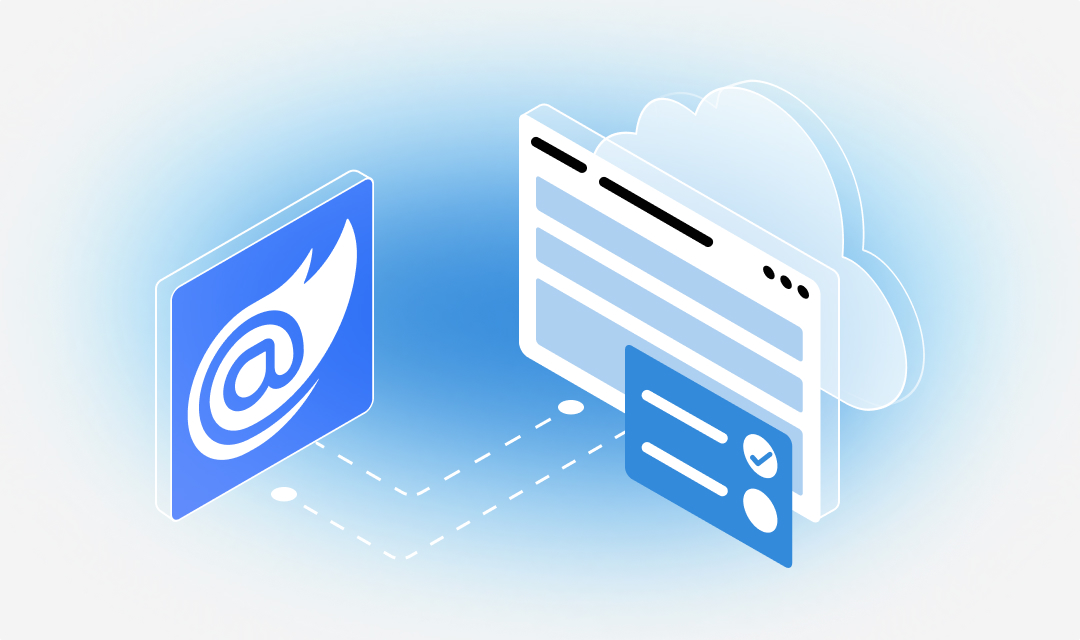
Why does Blazor WebAssembly run slower in Debug mode than after publishing?
Delays and overall performance are directly related to the execution mode of a Blazor WebAssembly application.
May 2026
Blog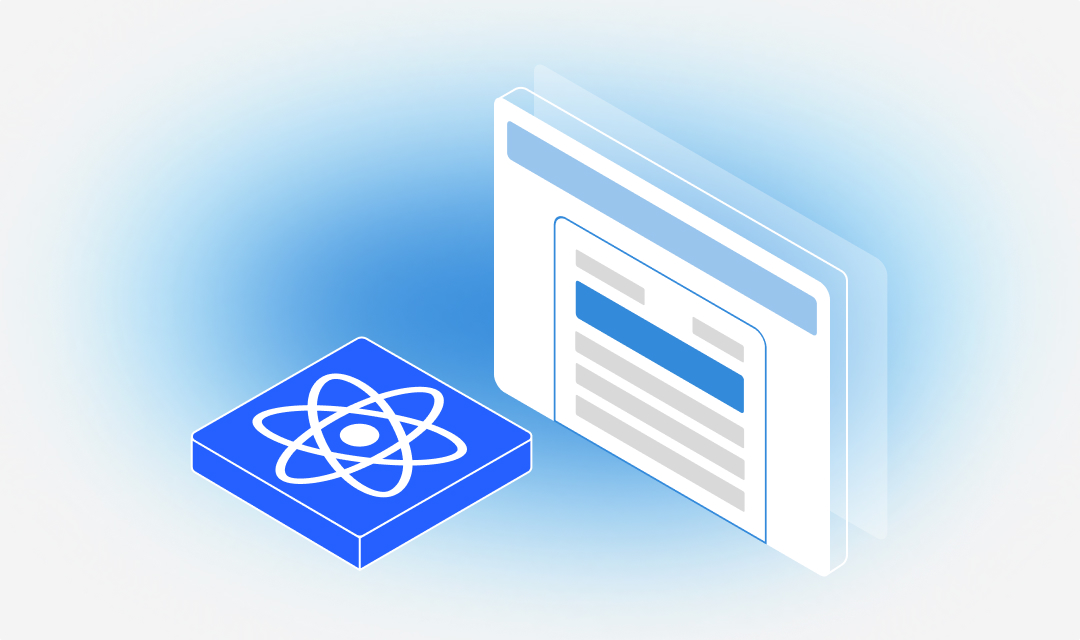
Using the Report Viewer Component for React Applications
Today, we'll explore how to use the React Viewer to display reports in ASP.NET Core web applications.
Blog
How to set report culture in Stimulsoft
Today’s article focuses on an important aspect of creating reports and dashboards - their localization, specifically the culture settings of a report.
April 2026
NewsStimulsoft Reports and Dashboards 2026.2 has been released!
We are excited to announce the release of a new version of Stimulsoft Reports and Dashboards - 2026.2!
BlogStimulsoft Documentation MCP Server
Stimulsoft Documentation MCP Server connects AI assistants directly to the official Stimulsoft Reports & Dashboards developer documentation.
March 2026
News
Stimulsoft Reports and Dashboards 2026.2 coming soon
A new version of our products is coming very soon. In this article, you will find the key updates and new features.
Blog
Stimulsoft documentation in Markdown
Today we would like to share an important update: all Stimulsoft documentation, including user guides for the report and dashboard generators as well as the report server, has been exported to the...
Blog
Data transformation. Part 1: Joining tables
We are launching a series of articles dedicated to Data Transformation, a tool designed to transform data sources within the data dictionary.
February 2026
Blog
How do I transfer the use of a product license to another computer?
Transferring a desktop report designer license to a new computer is sometimes necessary - whether you are upgrading hardware or replacing a device.
Blog
Support for Factur-X 1.08 and ZUGFeRD 2.4 versions in Stimulsoft products
German ZUGFeRD and French Factur-X are standardized data formats for exchanging electronic invoices between suppliers of goods and services and their customers.
January 2026
Blog
How do I assign a license to my company’s developer?
Managing software licenses is essential for keeping your development process organized, secure, and compliant.
December 2025
NewsOur achievements in 2025
Every year, at Stimulsoft, we highlight the most significant innovations and improvements to our products.
NewsStimulsoft Reports and Dashboards 2026.1 released!
We are pleased to announce the release of version 2026.1 of Stimulsoft products for creating reports and dashboards!
News
Support for .NET 10.0 in Stimulsoft products
On November 11, 2025, Microsoft officially introduced .NET 10.