




















Stimulsoft company blog
In the Stimulsoft blog you'll find useful articles that describe functional features of the products for creating reports and dashboards, the latest company news, thematic series of notes and a lot of other useful information.Featured reading
 14 Apr 2026 · Tim Crawford
Stimulsoft Documentation MCP Server
Stimulsoft Documentation MCP Server connects AI assistants directly to the official Stimulsoft...
 30 Jan 2024 · Alex Markus
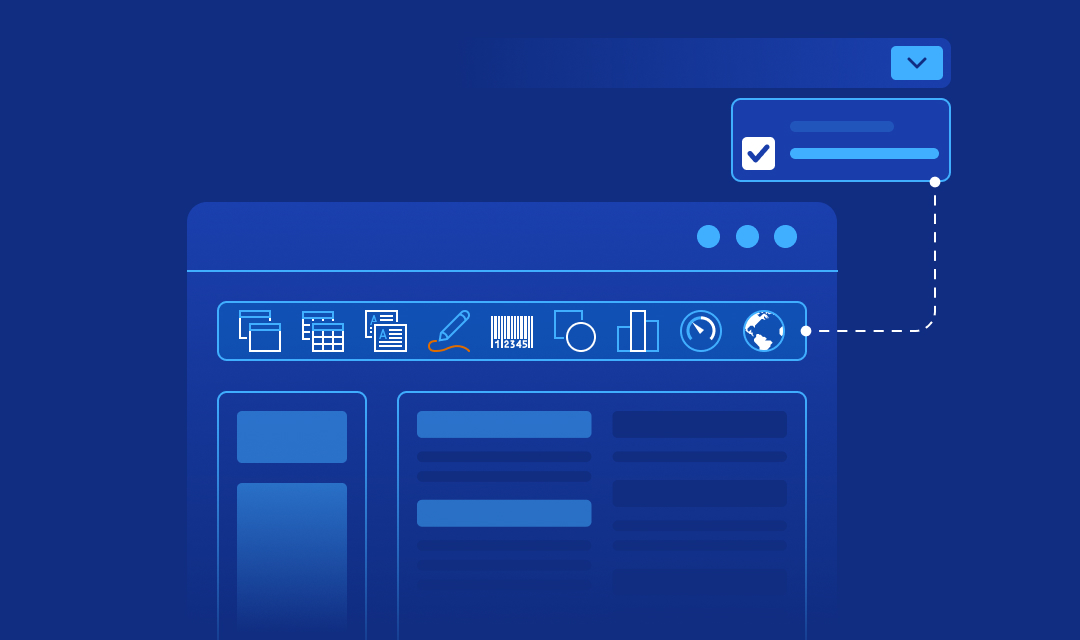
Simplified Ribbon
Today, we will discuss one important innovation in the Stimulsoft Reports, Dashboards, and Forms...
 10 Nov 2023 · Eliza Leppik
Exporting a dashboard from code
Today, we will analyze in detail the process of exporting a dashboard and its elements from code.
 8 Dec 2022 · Alex Markus
Working with updated products for PHP
One of the main enhancements in version 2023.1 is a significant update in our Reports.PHP and...
 12 Oct 2022 · Eliza Leppik
Stimulsoft BI Server. Administration.
In this article, let's take a closer look at the issues concerning server administration.
May 2022
 17 May 2022 · Tim Crawford
Sorting of months
In this article, we are going to tell you about ways of sorting months in dashboards.
 11 May 2022 · Alex Markus
Rounding in charts
In this article, let’s look closer at rounding in charts.
 6 May 2022 · Rodion Tamm
Dashboard element Table
This time you will know about the Table element and how to create a dashboard with it.
 4 May 2022 · Alex Markus
Pictorial Stacked Chart is a new chart type in Stimulsoft reporting tools
Today, we’re going to tell you about a new chart type – Pictorial Stacked Chart.
April 2022
 27 Apr 2022 · Alex Markus
Internet Explorer, ES5, Stimulsoft
In the 2022.2 release, we have added an ability to compile scripts of a product to ECMAScript 5 (ES5), which works in Internet Explorer 11.
 21 Apr 2022 · Tim Crawford
New component for dashboards – Cards
Today’s article will tell you about a new dashboard element, which has been available in Stimulsoft products since the 2022.2 release – Cards.
 14 Apr 2022 · Tim Crawford
QR codes customization in Stimulsoft Reports
We continue to acquaint you with the new functionality, which has become available in Stimulsoft reporting and data analytics tools since the 2022.2 version.
 12 Apr 2022 · Tim Crawford
Data connection in the report designer
This time, we will tell you about work with the report designer, and today we’re starting with the first and crucial step – data connection.
 8 Apr 2022 · Rodion Tamm
Button – a new element for creating dashboards
Today, we are going to tell you about a new element for dashboards – Button. This special element allows you to execute various scripts by click or depending on a condition.
March 2022
 30 Mar 2022 · Tim Crawford
First run of the report designer
There are a lot of services and reporting tools, but their main element – report designer. This application is used for creating, designing and editing reports and dashboards.
 9 Mar 2022 · Tim Crawford
Remote access to view reports and dashboards
This article will tell you about features of remote access to view reports and dashboards, Share command in the report designer.
 2 Mar 2022 · Tim Crawford
Report structure
Today in the article, we will talk about the structure of the components in the report.
February 2022
 23 Feb 2022 · Tim Crawford
Interpretation and Compilation. Blockly
Today, in this article, we will tell you about the expression calculation mode in a report. Actually, there can be only two – Interpretation and Compilation.
 17 Feb 2022 · Tim Crawford
Mobile mode of editing dashboards
The Mobile dashboard design version can display the current dashboard on mobile devices but not change it conceptually.
 15 Feb 2022 · Tim Crawford
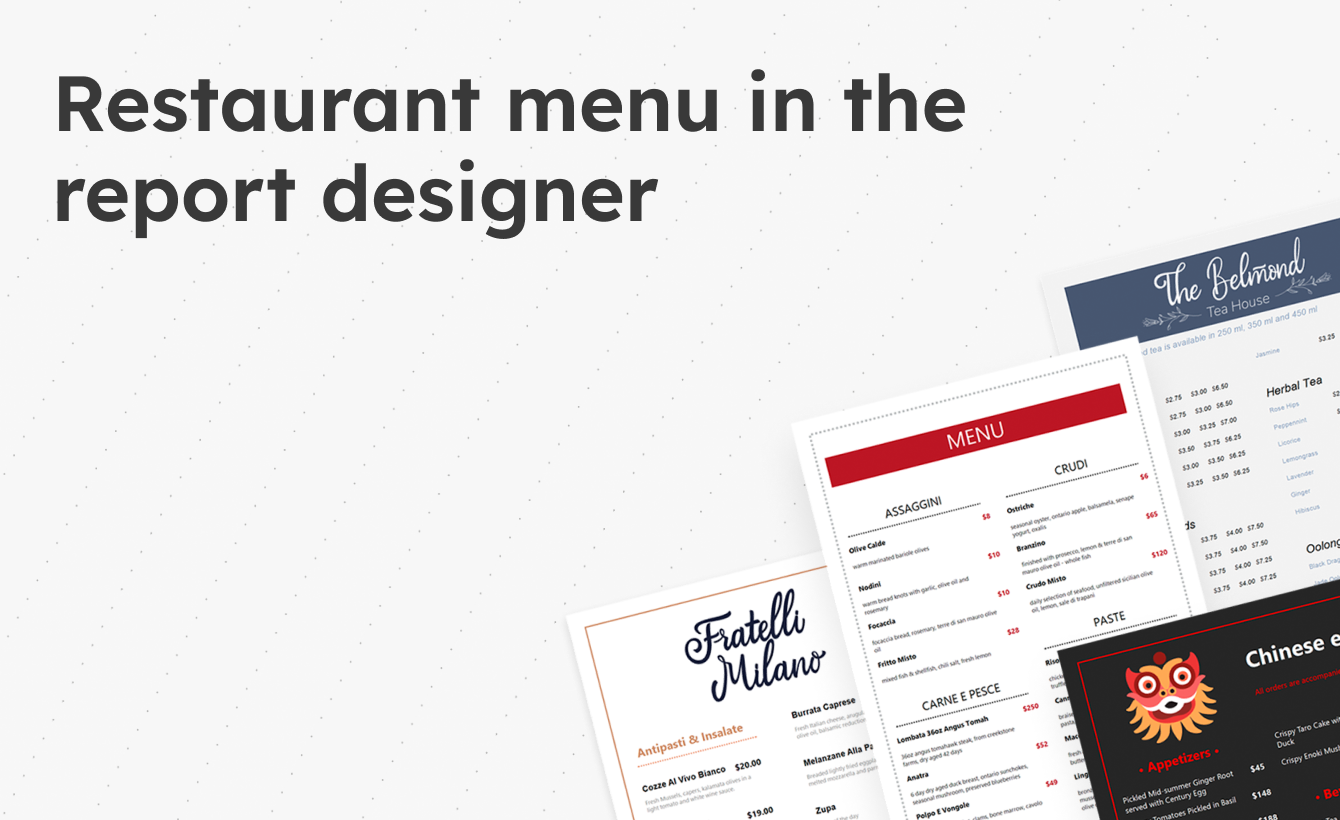
Restaurant menu in the report designer
Today, we will talk a little about using the reporting tool in various spheres, for example, in HoReCa.