
Creating reports using OData data sources
Stimulsoft Designer easily integrates with OData. You can retrieve data and create reports based on it. Our tools allow you to represent data in a neatly organized way and provide interactive reporting for our users.What is OData?
OData, abbreviated from Open Data Protocol, is an open protocol that allows creating and using accessible RESTful APIs for requests and interactions in a simple and standard way. It enables interaction with data over RESTful interfaces and supports the description of data models.
Simplicity of using

Data filtering on the server side

Preliminary preparation

Versatility and cross-platform compatibility

Transparent integration
Using OData in Stimulsoft Reports
Stimulsoft Reports provides a modern, user-friendly interface that makes it easy to connect to OData databases, navigate tables, and select the data you need for reports efficiently.
The report generator ensures fast integration with OData, allowing users to quickly build reports from existing databases without the risk of losing data or functionality.
Stimulsoft offers advanced design tools to create visually appealing and dynamic reports based on OData queries. Features include drag-and-drop report elements, conditional formatting, and extensive customization options.
Stimulsoft Reports supports OData connections across multiple platforms, including Windows, macOS, and Linux, ensuring consistent reporting capabilities regardless of the operating system.
Users can define parameters, apply filters, and generate reports dynamically at runtime, providing interactive and personalized reports directly from OData database.
Stimulsoft offers detailed documentation, tutorials, and an active community forum focused on reporting from OData, ensuring that users can get help and share best practices.
Reports can include interactive features such as drill-downs, interactive sorting, and parameterized views, enabling deeper insights and exploration of OData.
Reports built with OData can be exported in a variety of formats, including PDF (with e-signature support), Excel, Word, HTML, and image formats like PNG and JPEG, making it easy to share and distribute results.
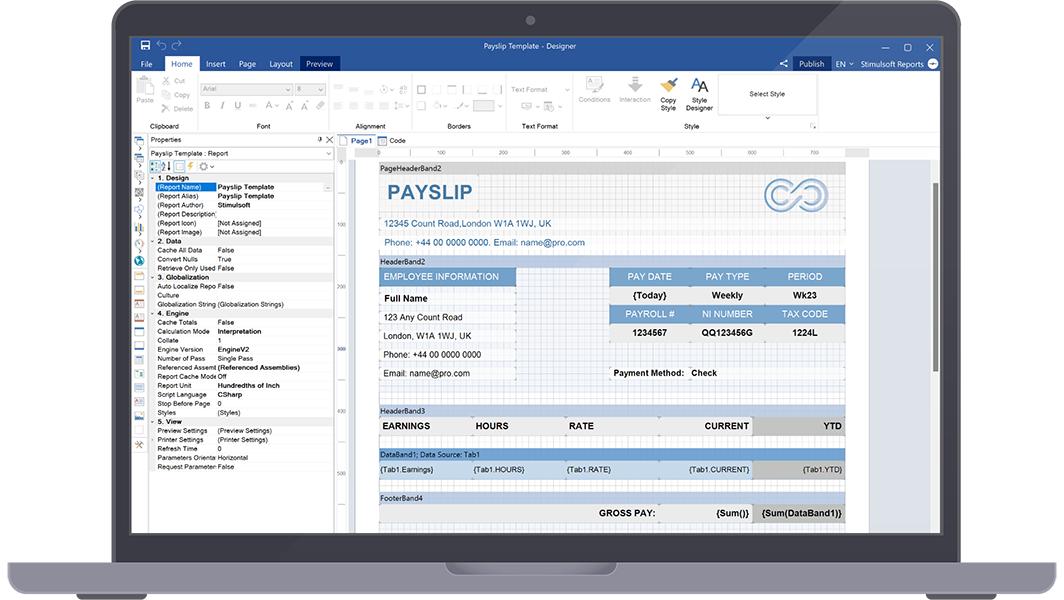
Designer app for creating reports
How to use?
Follow these five simple steps to create reports using OData.
-
Connect OData source −Create a new report and establish a connection to your OData data source by providing the URL or connection details of your OData service.
-
Create the layout +Create the layout of your report by adding data bands, tables, charts, and other necessary elements using the set of tools in Stimulsoft Designer. Configure the appearance and formatting of the report as needed.
-
Connect the data to the elements in report +Connect the information from your OData source to the elements in the report by selecting the appropriate data fields and matching them to the corresponding report elements.
-
Define the report parameters +If your OData service supports query parameters, define them to allow users to filter or configure the data displayed in the report. This adds flexibility and interactivity to the report.
-
View and export your reports +View the report to ensure that the data is displayed correctly. You can also export the document in various formats, such as PDF, Excel, or HTML, for sharing or future analysis.


Variety of export formats
Working with reports provides the ability to share them with colleagues or send them to management for review. Our products support exporting reports to multiple formats, including the popular PDF format with support for signatures and encryption, universal HTML for viewing in any browser, text (TXT) for printing on dot matrix printers, and many other document and image formats. Save rendered reports in the required format and share them conveniently in any way you prefer.Report samples
Our report generator supports the creation of a wide range of reports with rich components for data visualization and analytics. It allows you to use data from OData sources, offering flexible data querying, advanced display options, and multiple export formats. Check out some examples.What's next?
We have prepared hundreds of reports and dashboards templates grouped by spheres of use. You can immediately use them by connecting your data or change according to your requirements. Our lessons and technical documentation will help make your work effective! Moreover, you can request the training courses from our technical specialists, subscribe to our YouTube channel to always get new videos, and receive all your answers in our online documentation.
Training courses
Are you faced with difficulties when creating reports and dashboards? This is not a problem!
Video lessons
We have prepared many video materials for the designing reports and dashboards. All tutorials are grouped by specific topics and regularly updated and supplemented.
Documentation
Our online user guides describe both the general functionality of the product and provide advice and suggestions for the report design and hints of setting components for reporting.