
Expert reporting with PostgreSQL
Stimulsoft introduces a powerful and user-friendly tool for generating reports of any complexity using PostgreSQL. Our products are designed to simplify the processes of data analysis and visualization, making report creation both convenient and fast.Using PostgreSQL in Stimulsoft Reports
Stimulsoft Reports provides a modern, user-friendly interface that makes it easy to connect to PostgreSQL databases, navigate tables, and select the data you need for reports efficiently.
The report generator ensures fast integration with PostgreSQL, allowing users to quickly build reports from existing databases without the risk of losing data or functionality.
Stimulsoft offers advanced design tools to create visually appealing and dynamic reports based on PostgreSQL queries. Features include drag-and-drop report elements, conditional formatting, and extensive customization options.
Stimulsoft Reports supports PostgreSQL connections across multiple platforms, including Windows, macOS, and Linux, ensuring consistent reporting capabilities regardless of the operating system.
Users can define parameters, apply filters, and generate reports dynamically at runtime, providing interactive and personalized reports directly from PostgreSQL database.
Stimulsoft offers detailed documentation, tutorials, and an active community forum focused on reporting from PostgreSQL, ensuring that users can get help and share best practices.
Reports can include interactive features such as drill-downs, interactive sorting, and parameterized views, enabling deeper insights and exploration of PostgreSQL.
Reports built with PostgreSQL can be exported in a variety of formats, including PDF (with e-signature support), Excel, Word, HTML, and image formats like PNG and JPEG, making it easy to share and distribute results.
How it works?
Creating reports in Stimulsoft involves several steps: connecting PostgreSQL datasource, selecting components for displaying and analyzing data, customizing the appearance of the report, grouping and filtering data, and finally, saving or exporting the report to one of the many available formats.Universal compatibility
Our tools support all modern operating systems such as Windows, macOS, Linux (.deb and .rpm), as well as all modern browsers: Chrome, Edge, Safari, Mozilla, and others. Regardless of the platform you use, you can always rely on our tools to deliver superior performance in the context of creating PostgreSQL-based reports.

 Linux
Linux

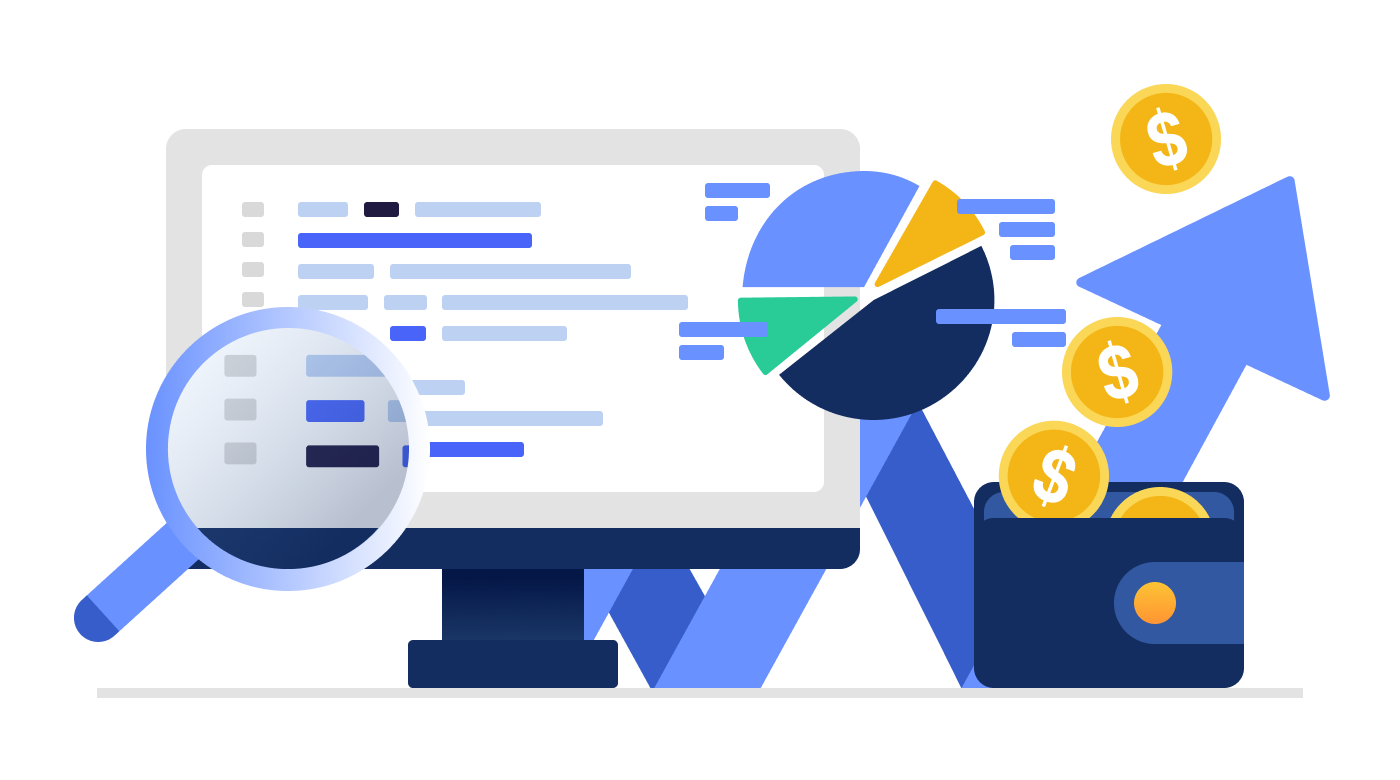
Visual Insights from PostgreSQL
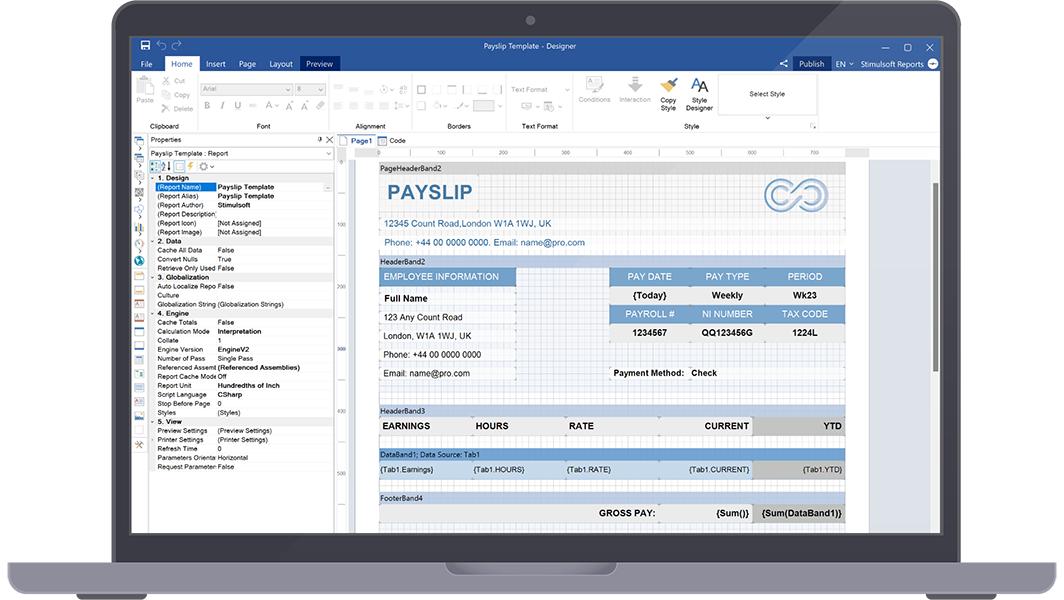
Turn your data into clear and meaningful visualizations by using a wide range of graphing and charting capabilities. We provide a variety of charts, including bar charts, pie charts, and line graphs, as well as 3D charts. Choose the format that most effectively communicates your information.Designer app for creating reports
Interactive reports
Elevate your reports to the next level with interactive features like drill-down, sorting, filtering, and parameter management. Explore and analyze your data in a dynamic and engaging manner.Miscellaneous
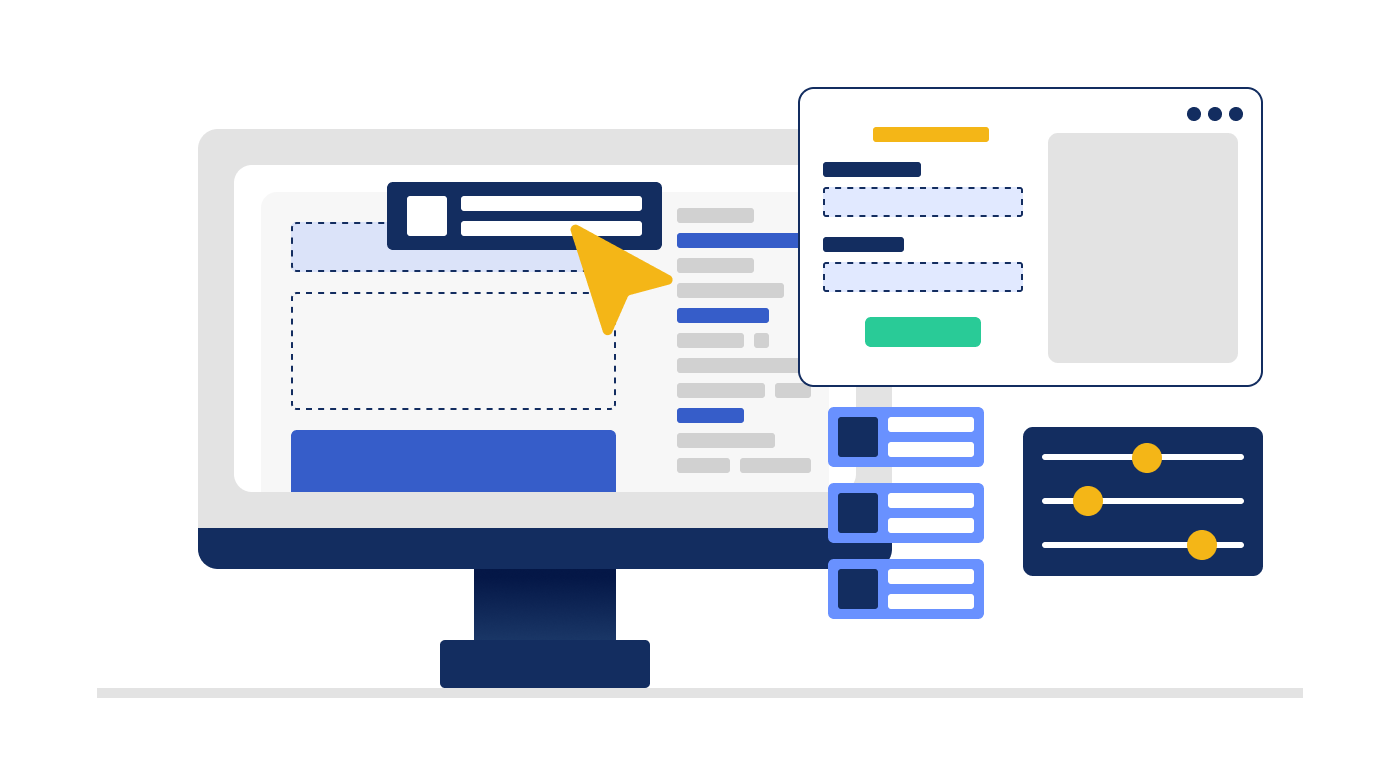
User-friendly interface
Our reporting tool boasts an intuitive and easy-to-navigate interface. Whether you are a beginner or an experienced user, creating and customizing reports is a breeze.
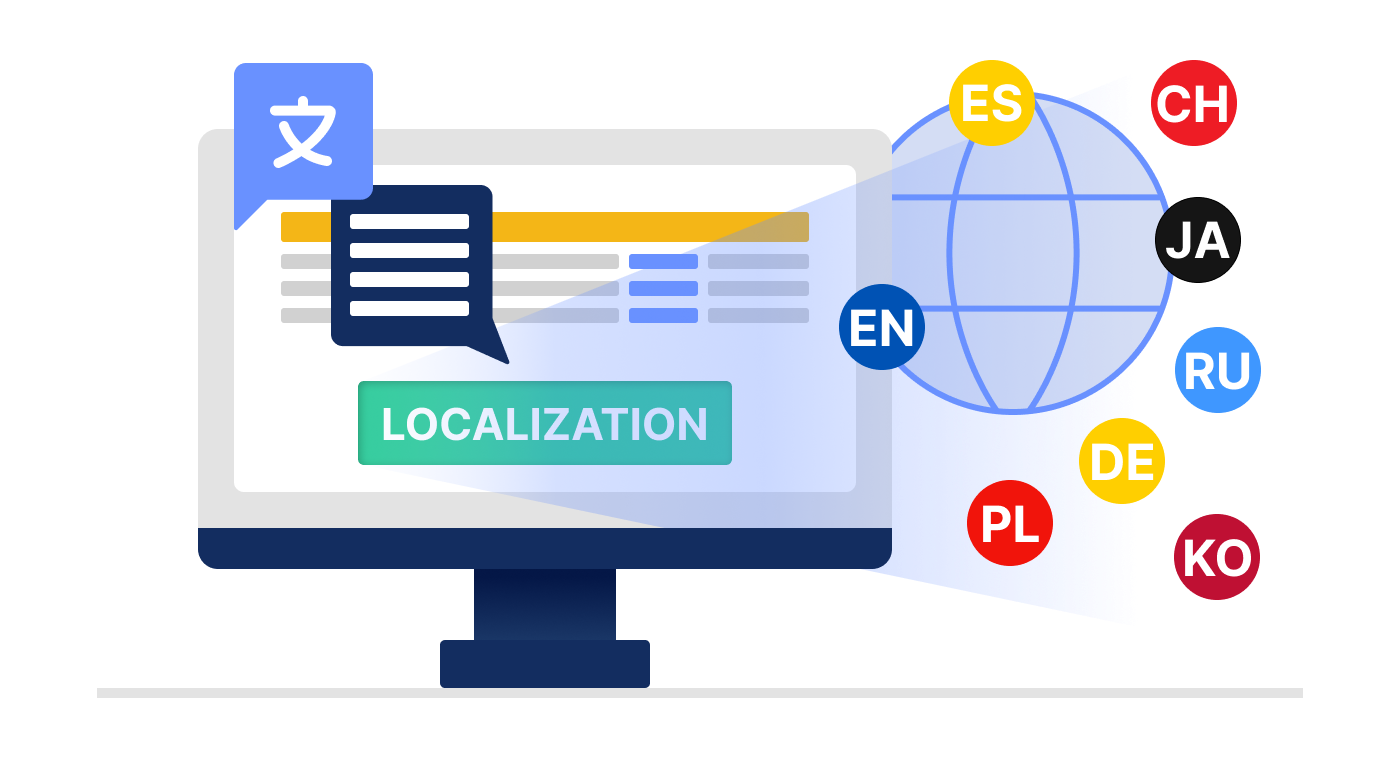
Localization Support
In our products, you will find comprehensive support for various localizations, including regional features of data entry, numbers, dates, native display of names in maps, and much more.

Professional community and support
Join a community of active users and gain access to excellent customer support, detailed documentation, forums, and regular updates. We are here to assist you every step of the way.
Cost-effective solution
Our pricing plans are competitive, providing you with an economical solution to create dynamic, insightful reports that move your business forward.
What's next?
We have prepared hundreds of reports and dashboards templates grouped by spheres of use. You can immediately use them by connecting your data or change according to your requirements. Our lessons and technical documentation will help make your work effective! Moreover, you can request the training courses from our technical specialists, subscribe to our YouTube channel to always get new videos, and receive all your answers in our online documentation.
Training courses
Are you faced with difficulties when creating reports and dashboards? This is not a problem!
Video lessons
We have prepared many video materials for the designing reports and dashboards. All tutorials are grouped by specific topics and regularly updated and supplemented.
Documentation
Our online user guides describe both the general functionality of the product and provide advice and suggestions for the report design and hints of setting components for reporting.