We continue the series of articles about the Stimulsoft report designer. We have recently told you about the Chart element and how to create a dashboard with it. Now we’re going to tell you about the Gauge element.
In the gauge, you may enter data both manually or add them from data sources. Data columns are specified in the following fields:
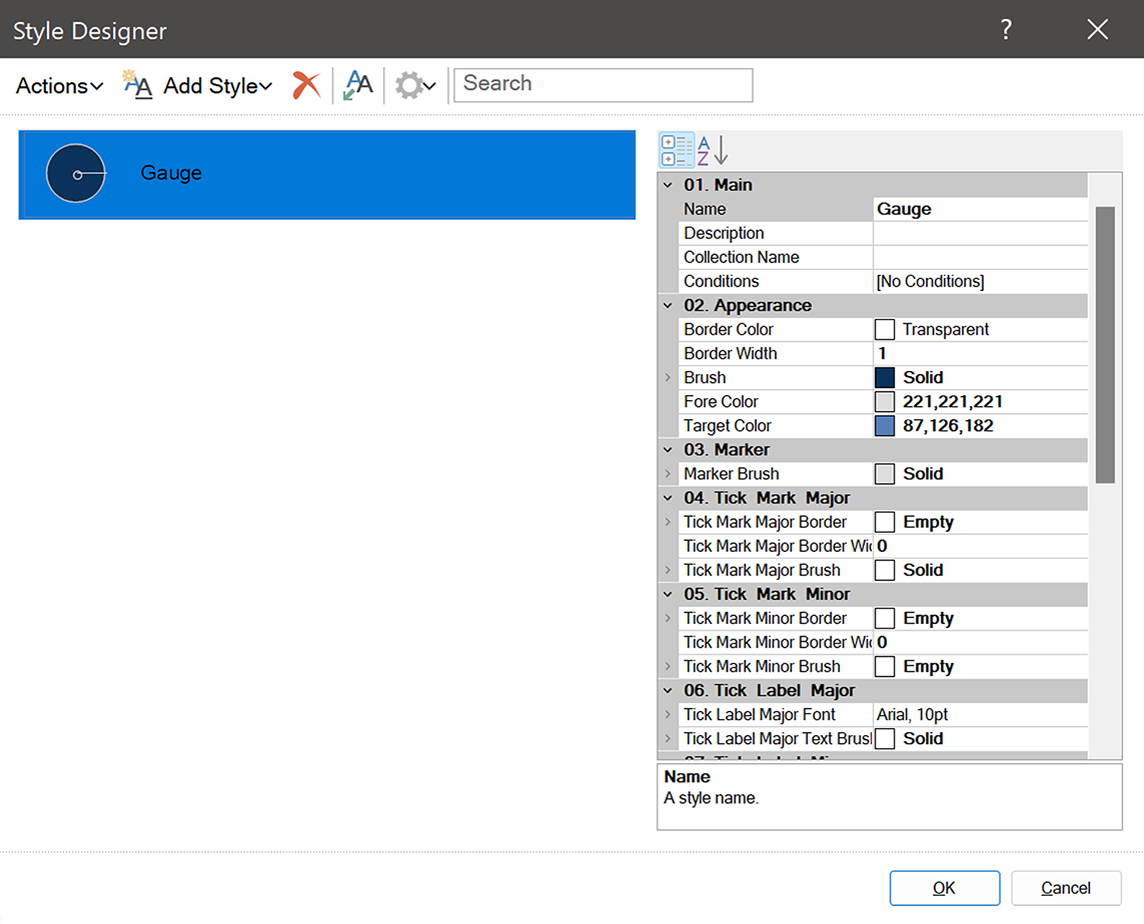
The Style designer will allow you to add one or several styles for your gauge and customize the brush, style font, format its borders, border sides, or create a collection of styles for the element. Also, you can create a style based on selected elements.
You can read about how to create a dashboard with this element in our documentation.
Gauge
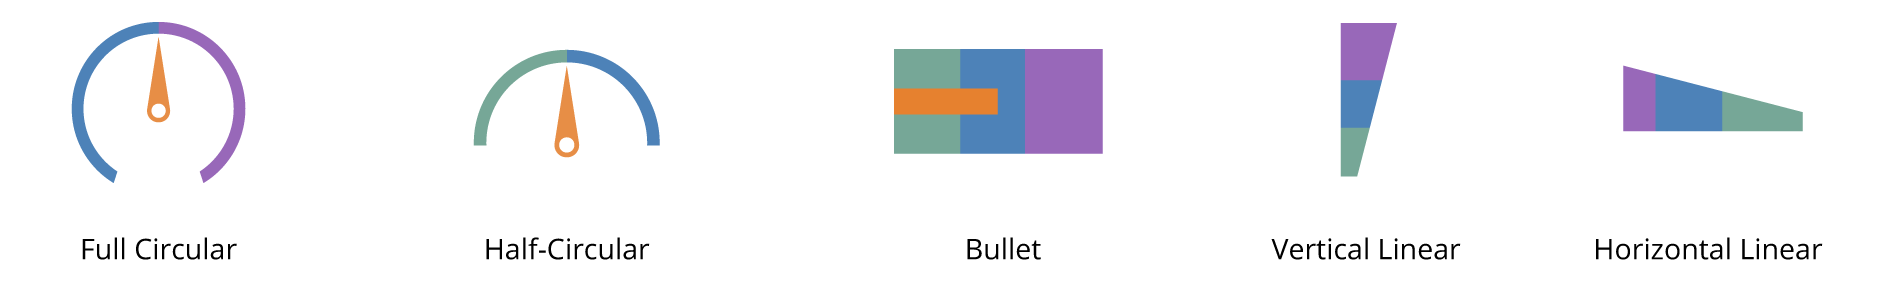
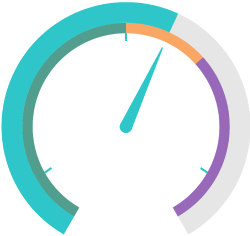
Gauge is a tool for data analysis that allows you to count values within a specified range. Using it, it’s possible to display processed values from data fields as a measuring device. The report designer contains five types of the gauge: Full Circular, Half-Circular, Vertical Linear, Horizontal Linear, and Bullet.Gauge editor
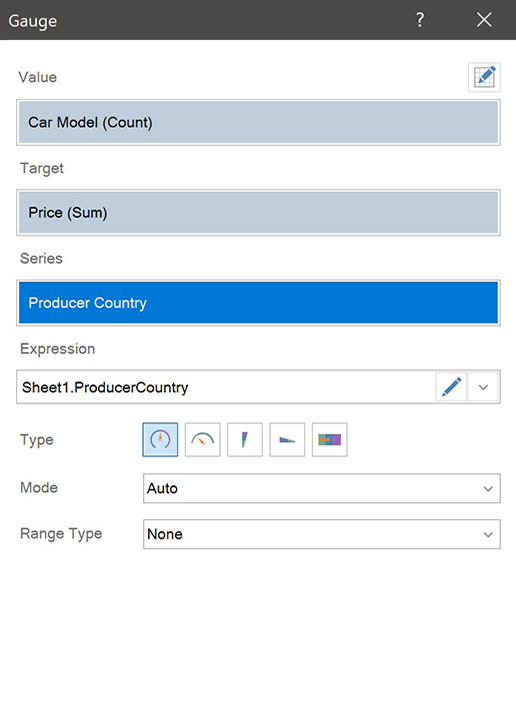
Let's take a look at the basic features and settings of this element.In the gauge, you may enter data both manually or add them from data sources. Data columns are specified in the following fields:
- Value;
- Target;
- Series.
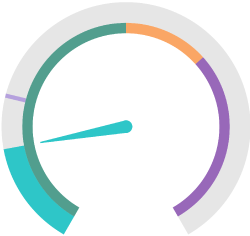
It's possible to create a range for all gauge types, having specified its minimum and maximum value. In addition to this, you can highlight a relative or an absolute part of a range with a specific color. For example: from 0 to 100 with green, from 100 to 135 with orange, and from 135 to 200 with violet.
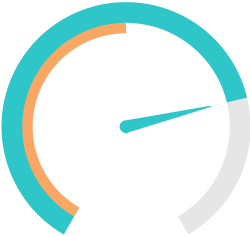
Also, it’s possible to specify an absolute and a relative share as a percentage for a range. For example, for the range from 0 to 200, you can specify a relative share of 50 percent.
Besides, you can customize gauge labels – enable, disable, and place them inside or outside of the element. The same settings are applied to the target – a separate graphic element for a specific segment of values.
Style designer
In the properties panel, you can select the back color for your gauge, customize its border and corner radius, select font, text color, and style. By the way, some words about the style – you may select it in the properties panel and customize it in the style designer.The Style designer will allow you to add one or several styles for your gauge and customize the brush, style font, format its borders, border sides, or create a collection of styles for the element. Also, you can create a style based on selected elements.
You can read about how to create a dashboard with this element in our documentation.
In the next article, we will tell you about the Online Map dashboard element. If you have any questions regarding the gauge or creating a dashboard with it, please This email address is being protected from spambots. You need JavaScript enabled to view it. .