Stimulsoft company blog
In the Stimulsoft blog you'll find useful articles that describe functional features of the products for creating reports and dashboards, the latest company news, thematic series of notes and a lot of other useful information.Featured reading

Our achievements in 2025
Every year, at Stimulsoft, we highlight the most significant innovations and improvements to our...
Stimulsoft Reports and Dashboards 2026.1 released!
We are pleased to announce the release of version 2026.1 of Stimulsoft products for creating...

Stimulsoft Reports, Dashboards, and PDF Forms version 2025.4 has been released!
We are honored to announce the release of Stimulsoft software version 2025.4 for creating reports,...

OpenStreetMap as a new online maps provider
An important change has been made to the operation of Stimulsoft products for creating dashboards:...

Stimulsoft Reports, Dashboards, and PDF Forms 2025.3 is released!
We are proud to present the release of a new version of Stimulsoft products for creating reports,...
February 2023

Changes to Stimulsoft Terms & Conditions for Subscriptions
We have important news regarding changes to our subscription and licensing model in 2023.
December 2022

Results of 2022
The end of December is the time to look back. In this article, we have collected all the most important things we did in 2022.
2023.1. New version of Stimulsoft Reports and Dashboards.
We are pleased to announce the release of Stimulsoft Reports and Dashboards version 2023.1!

Optimizing reports and dashboards tools for Blazor apps
Today we would like to share one of the future enhancements that concern the Reports.BLAZOR and Dashboards.BLAZOR products.
November 2022

Stimulsoft PHP products update
Today we want to tell you about the update of popular products – Stimulsoft Reports.PHP and Stimulsoft Dashboards.PHP.
September 2022
Version of Stimulsoft Reports and Dashboards 2022.4 is already here!
We are pleased to announce the release of a new version of Stimulsoft Reports and Dashboards 2022.4!
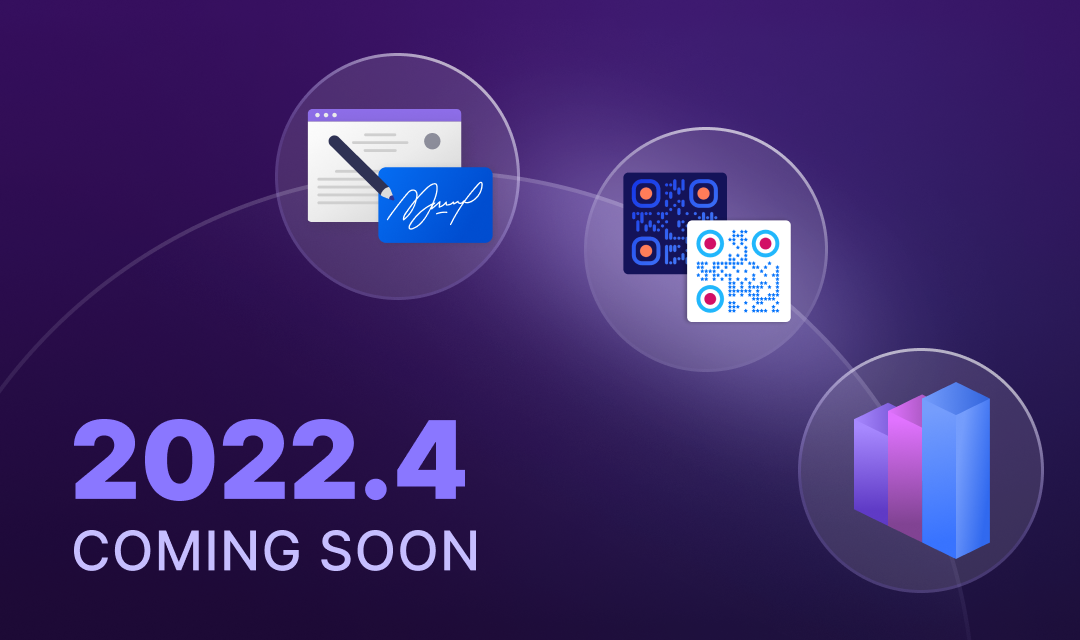
Version 2022.4. Coming soon
The new version of Stimulsoft products will be released very soon, but in the meantime we would like to introduce you to its main new features.
August 2022
Support for M series chips in the report designer for macOS
Starting with version 2022.3, the Stimulsoft report designer for macOS supports the work with the M series of computer chips designed by Apple Inc.
June 2022
Stimulsoft Reports and Dashboards. New version 2022.3 released!
Among basic new features, we would like to highlight a new product for creating dashboards in Blazor applications, a new graphical library for .NET Core components, the GraphQL data adapter, Ribbon...

End of support for .NET Standard 2.0
Starting with the next version, 2022.3, we will stop supporting .NET Standard 2.0 for all our Web components.
May 2022
Transition to the ECMAScript 2017 standard
Starting from the next version – 2022.3 – Reports.JS and Dashboards.JS products are transiting a new language standard – ECMAScript 2017.
March 2022
Stimulsoft Reports and Dashboards. New version 2022.2 released
In this release, we have added new elements, extended the functionality of existing components, and optimized the work of products for more rapid and convenient data analysis.
Stimulsoft Reports and Dashboards 2022.2 – coming soon
Today, we are announcing the upcoming release of a new version of report generators and business intelligence tools of Stimulsoft 2022.2.
February 2022

Stimulsoft is in the top 50 software publishers!
ComponentSource company, our longtime marketplace and software sales partner, has announced the nominees of its annual Bestselling Product Awards for 2022.
PHP 8.1 and Stimulsoft products
The release contains many improvements and new features, which significantly influenced the work of the projects created using PHP.