We are honored to announce the release of Stimulsoft software version 2025.4 for creating reports, dashboards, and fillable PDF forms! This update introduces the ability to run C# scripts in Reports.JS, support for an AI assistant for report creation, two new chart types, customizable time formats for displaying report variables in the parameters panel, and much more. You can find the full list of new features in this article.
A list of the new features in version 2025.4

C# scripts in Reports.JS
In version 2025.4.1, we introduced support for running C# scripts in report component expressions, variables, and calculated columns. For new reports, the Script Language property is set to C# by default, while existing reports will continue to use JavaScript. You can disable script execution entirely using the Allow Scripts to Run property, or restrict it only within expressions using the Allow Scripts in Expressions property.Parameters dialog
We have added the ability to display report and dashboard parameters in a dialog box before they appear in the viewer. To enable this, set the Parameters Display Mode property to Dialog. In this mode, the parameters are shown in a separate window; the report will not be generated, and the dashboard will remain visible until the Submit button is clicked in the parameters window.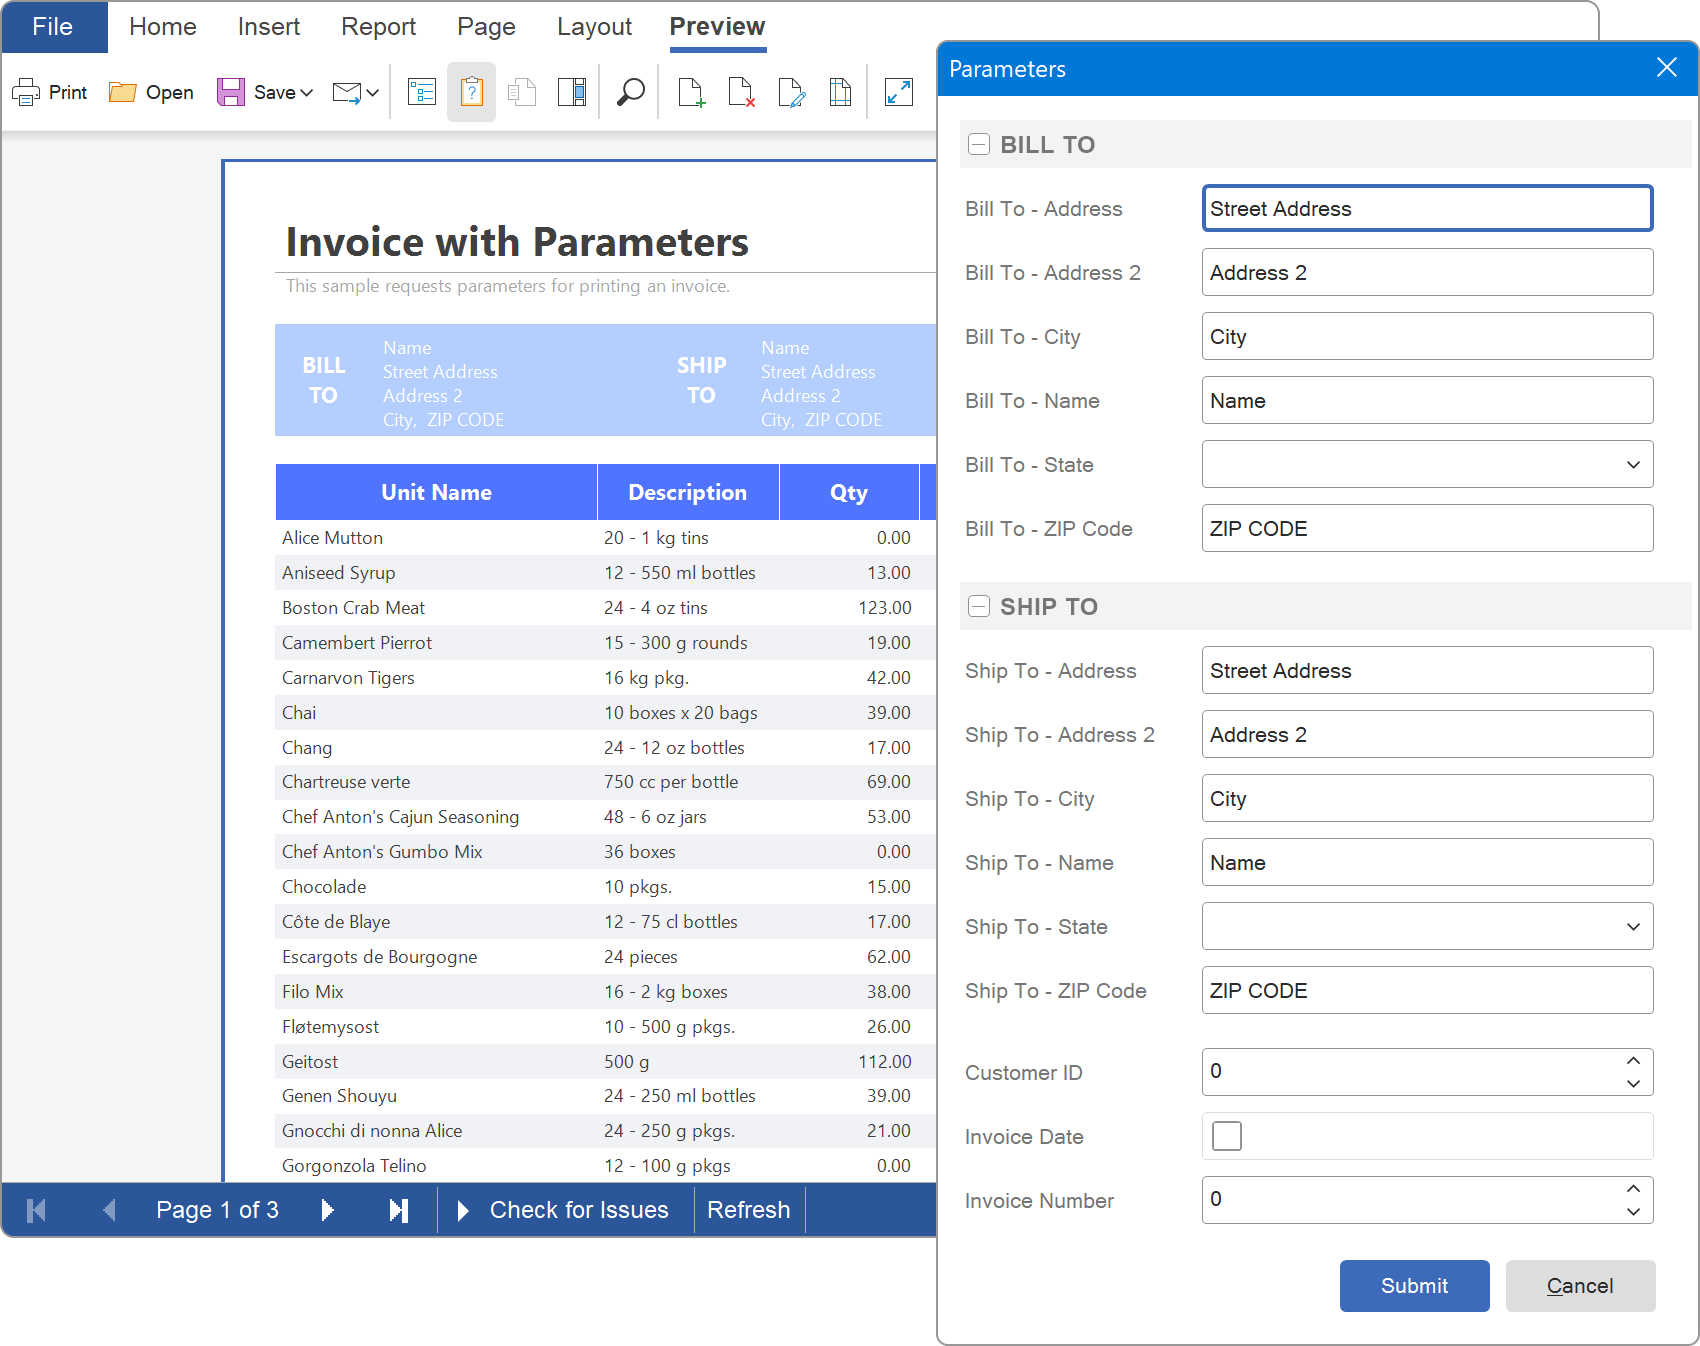
AI Wizard
Stimulsoft Designer now includes an AI assistant for report creation. Report creators can generate reports from connected data sources using a single text query. The assistant supports simple lists, grouped reports, master-detail reports, and column-based reports. You can further customize (change the appearance) a report’s design with a custom query. The AI wizard can be enabled or disabled using the Show 'Stimul AI' option in the Options window of the report designer.
New charts
Surface chart
A 3D chart for reports and dashboards will visualize data as a surface (grid), showing the relationship between three variables.3D Area chart
A new 3D chart type in reports and dashboards will work like the standard Area chart, but with depth and perspective for better visuals and analytics.Time Format in Parameters
Starting with version 2025.4.1, you can define a custom time format for displaying report variables in the parameters panel. The format mask can be configured in the variable editor when creating or editing a variable. Time formats are supported for variable data types such as DateTime, TimeSpan, and TimeOnly.Running Average for Data Transformation
In this release, we have added a new data transformation action: Running Average. You can now calculate a running average for columns and even specify a starting value. To disable the running average calculation, simply leave the value field blank in the action editor.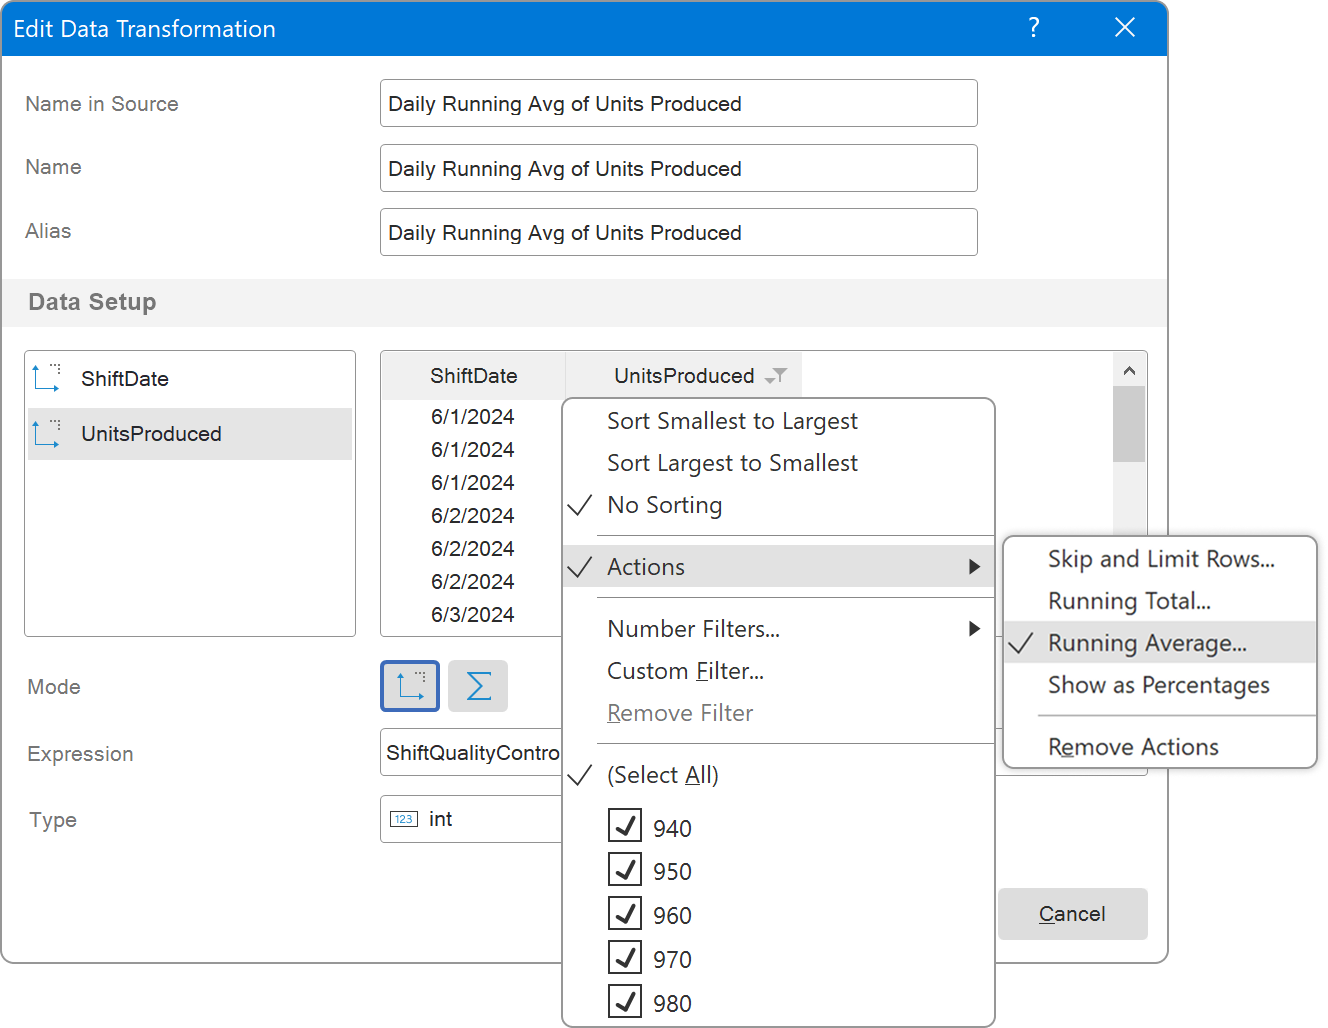
New PageLine system variable
We have also added a new PageLine system variable, which can be used to number rows within a single report page. The numbering resets when moving to the next page. The PageLine variable can be used in simple lists, as well as in reports with columns, grouping, and master-detail layouts.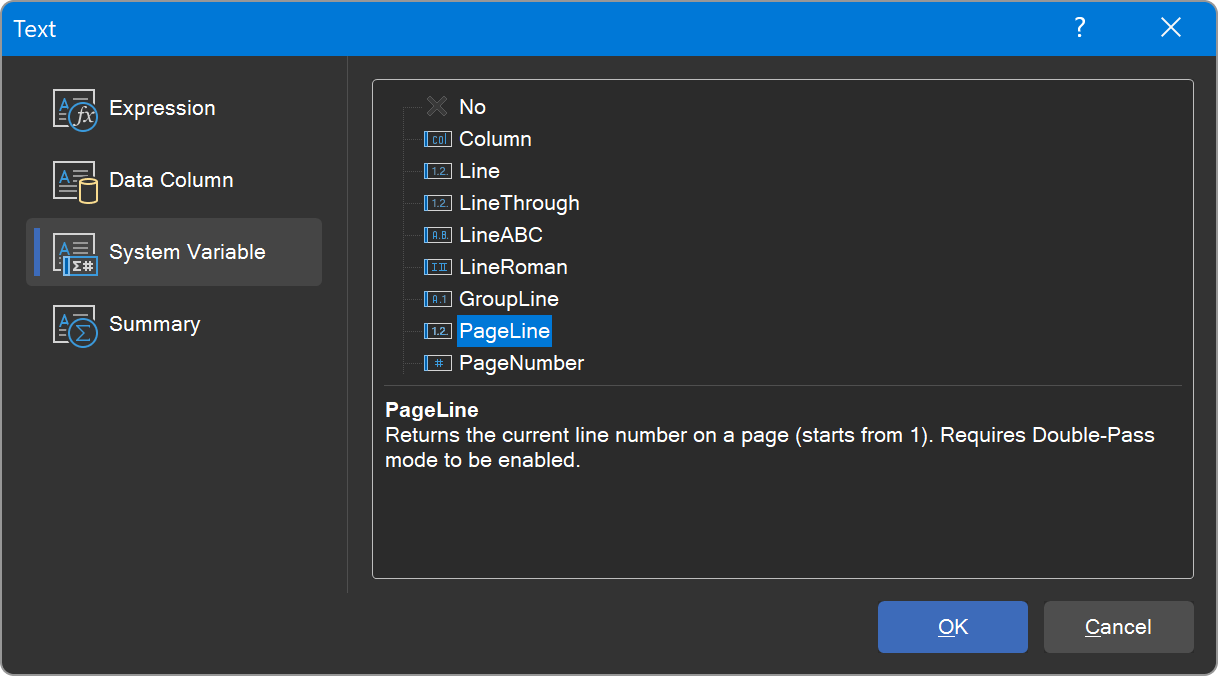
Click Event for dashboard elements
The Click event has been added to the Cards, Chart, Gauge, Image, Indicator, Progress, Shape, and Text elements of dashboards. This event allows you to execute various actions when an element is clicked in the viewer. Scripts can be created using Blockly visual programming or a report scripting language such as C#, VB, or JavaScript.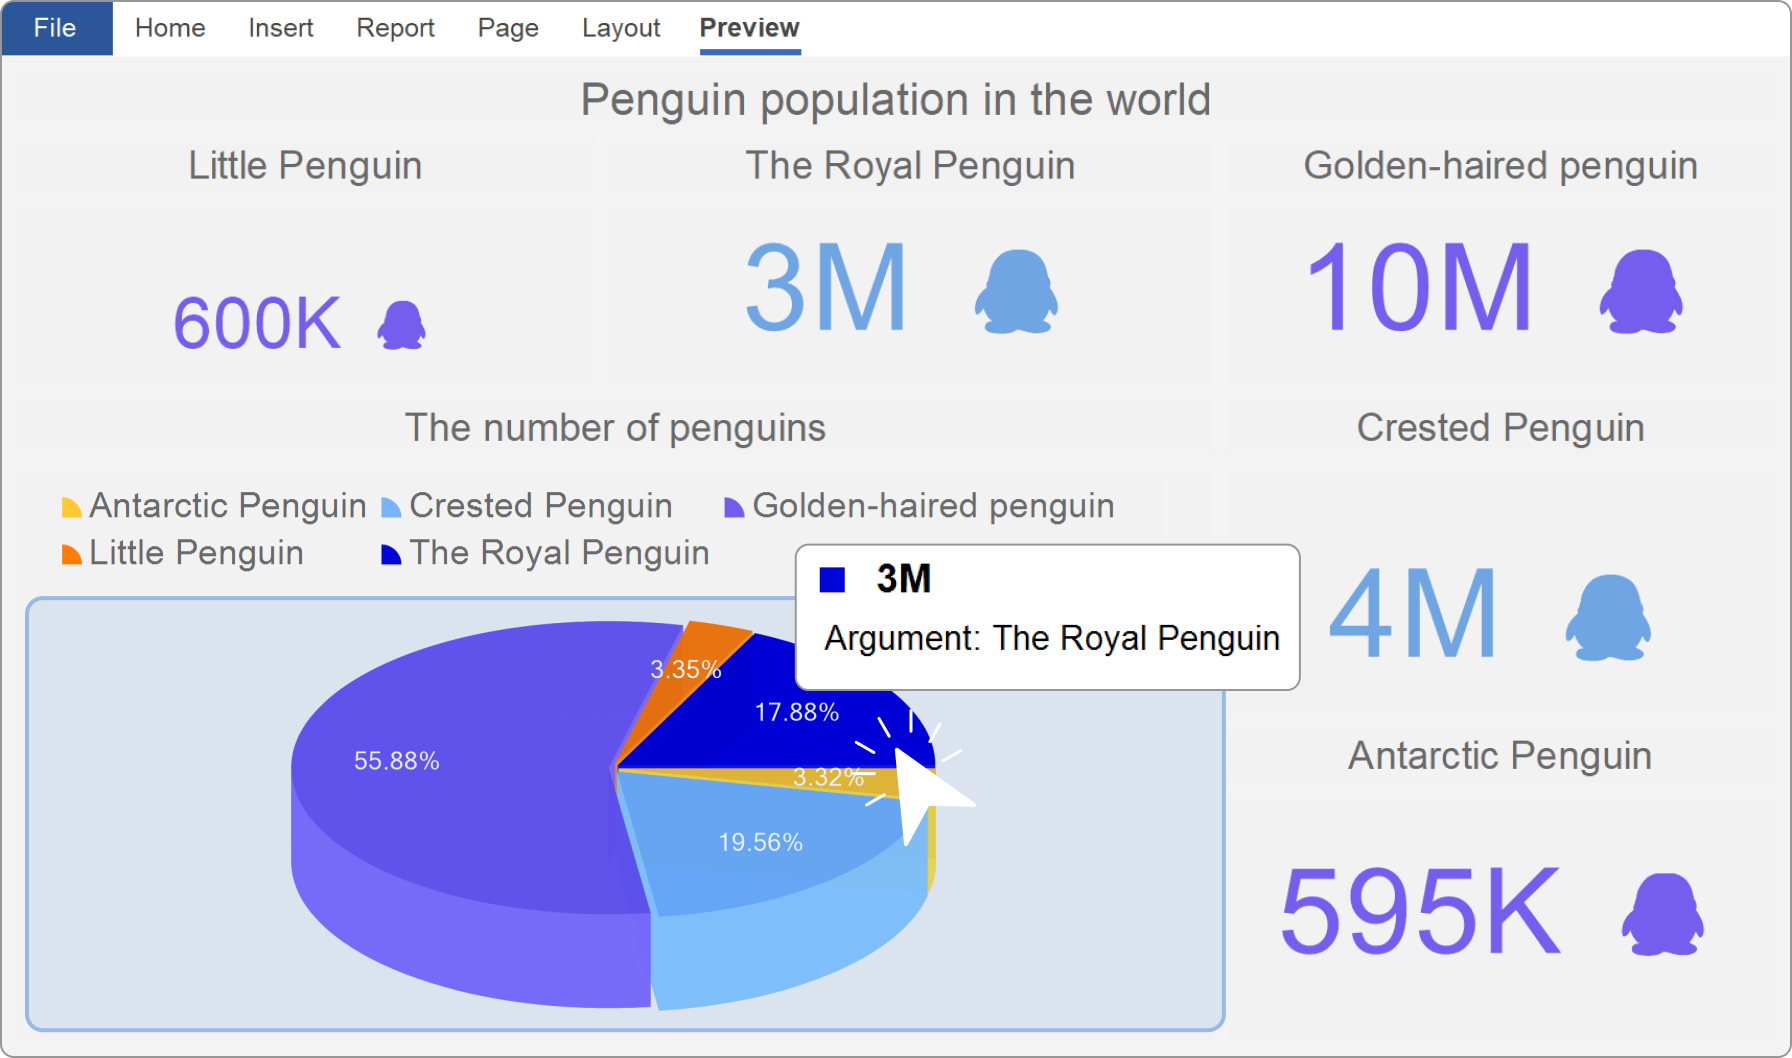
Support Request Parameters for Dashboards
We have added support for requesting parameters before displaying a dashboard in the viewer. To enable this, set the Request Parameters template property to True. In this mode, dashboard elements will not display values until the Submit button is clicked on the panel or in the parameters window.Max Selected Items
A key feature of this release is the ability to limit the number of simultaneously selected values in List Box and Combo Box dashboard elements. This limit can be set using the Max Selected Items property, which accepts a numeric value representing the maximum number of selections. By default, this property is set to 0, meaning there is no limit and all values in the filter elements can be selected.New keys in the Tooltips
We have added new keys to the List Box dashboard element: displaying the value, key, and index of the current element on hover.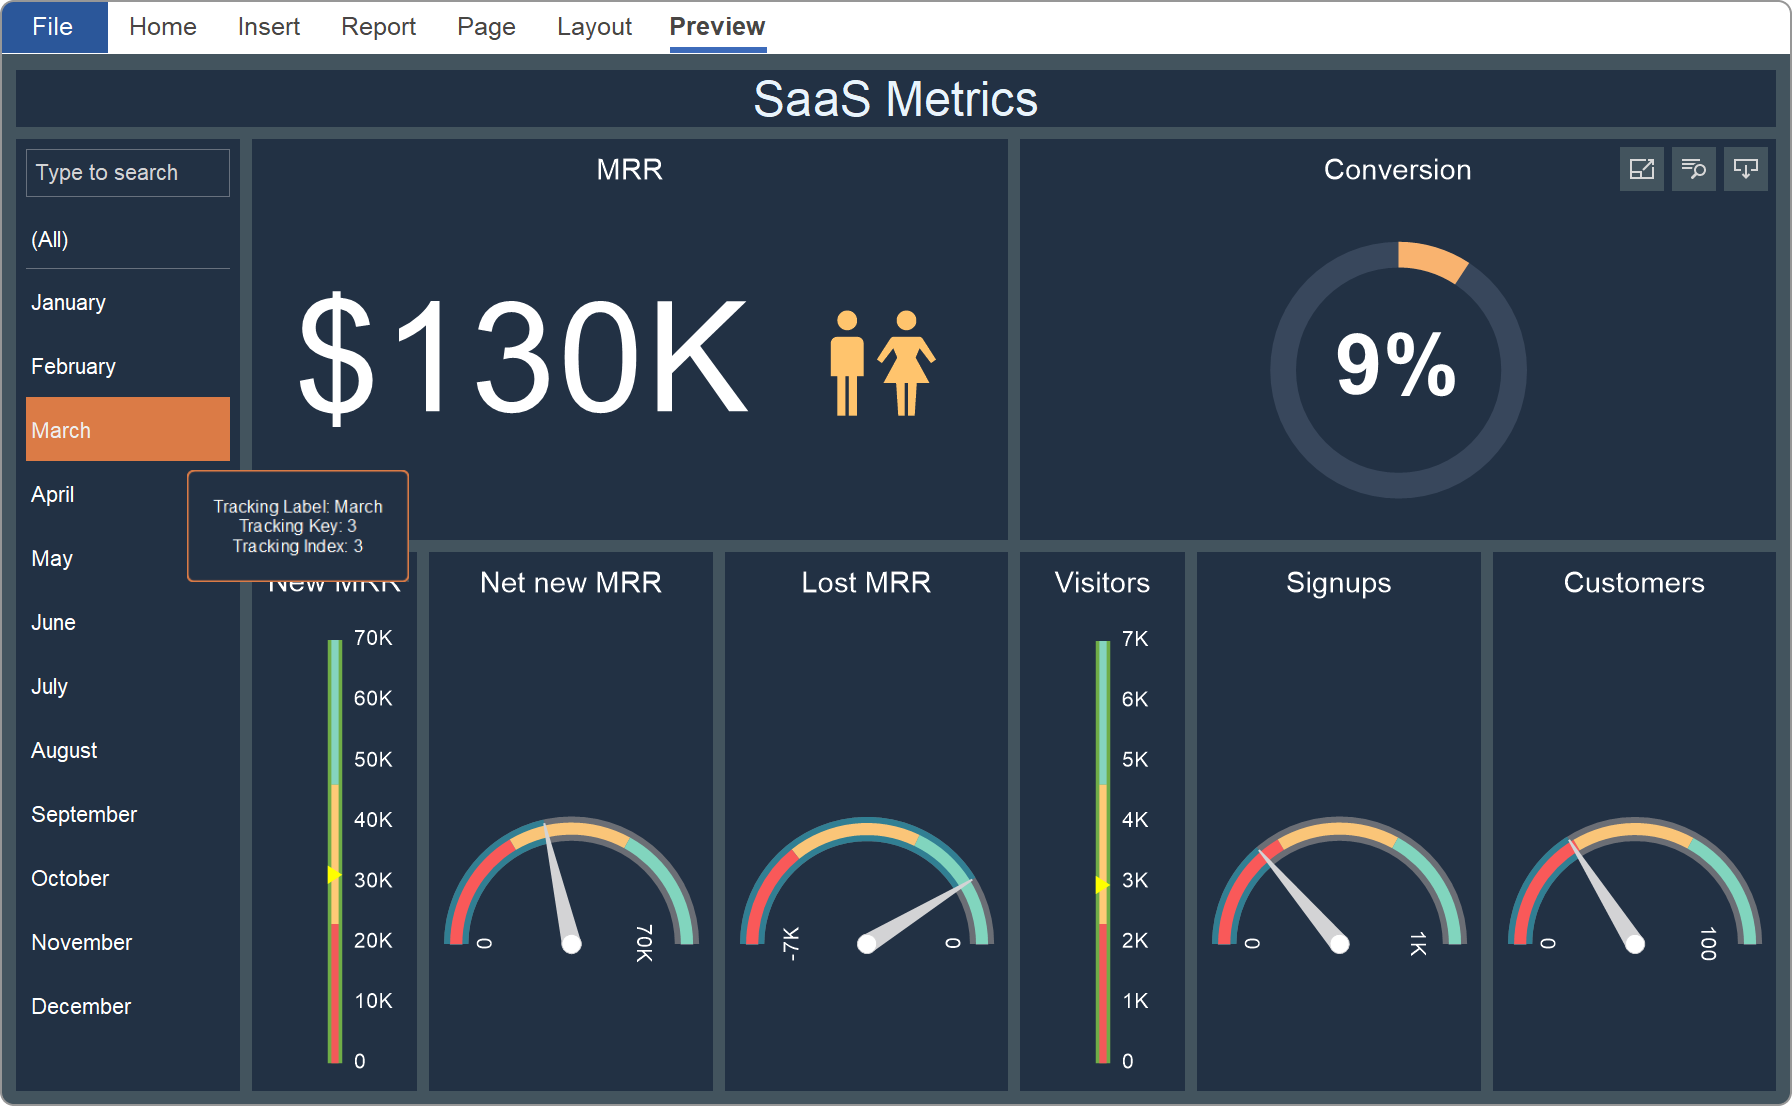
ImageFormat for RTF export
In the RTF export settings, you can now choose between JPEG and PNG image formats. By default, automatic image format detection is used, where all formats except JPEG are saved as PNG.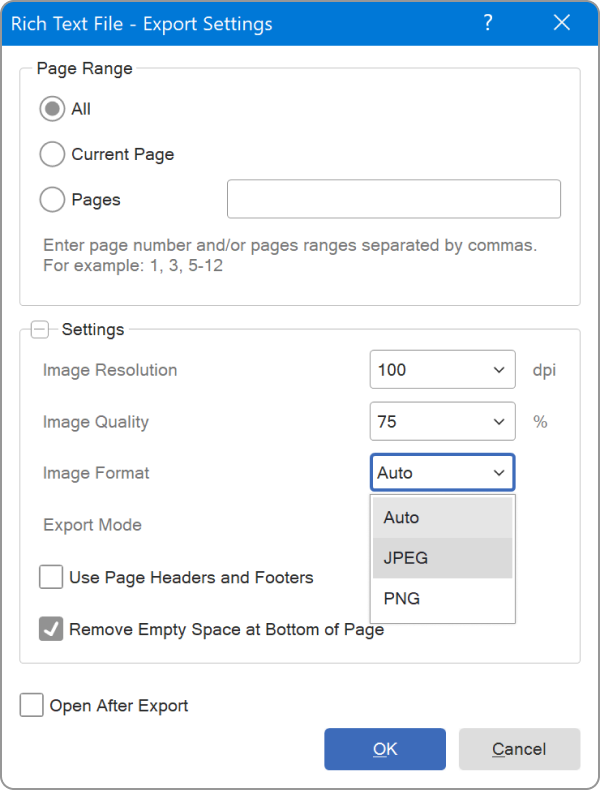
New tool in Server
We have also developed a new tool to safely migrate Stimulsoft Server from one host to another. This tool allows moving all server resources, including document templates, scheduler settings, directory hierarchy, users, and workspaces. Please note that activation is not transferred to the new host, you will need to do this again.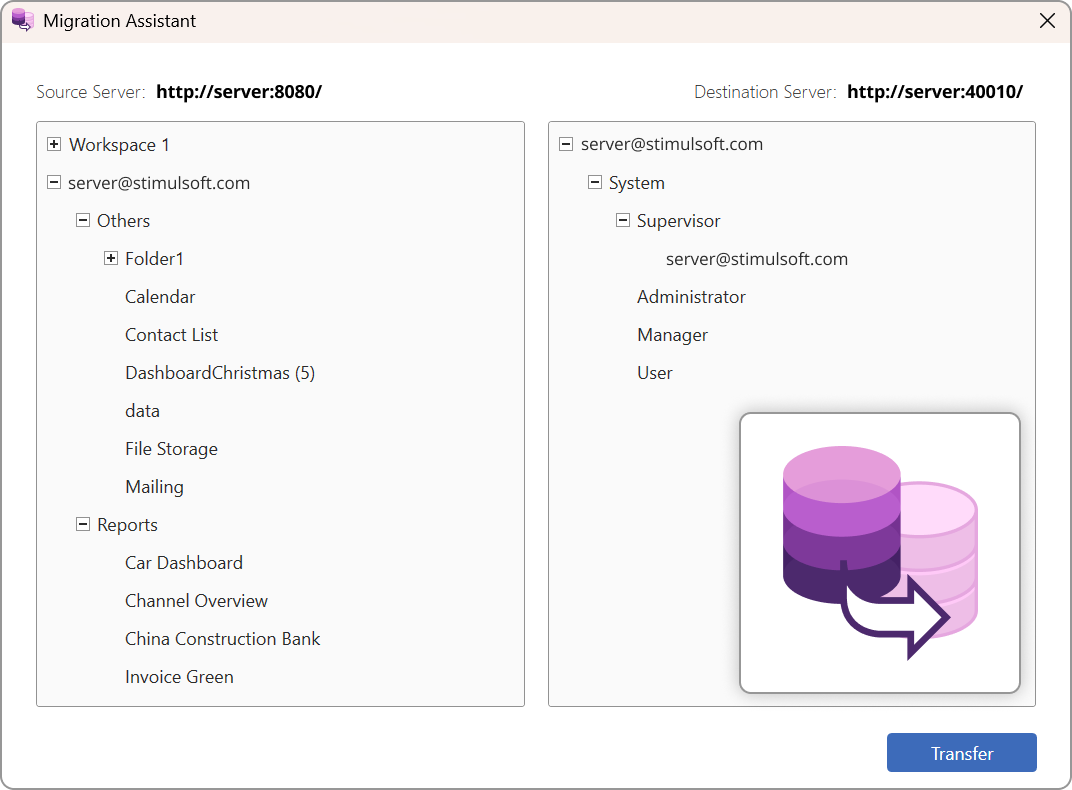
Out of support for .NET Core 3.1 and .NET 5.0
In line with Microsoft policy and current software development standards, starting with version 2025.4.1, we will end support for .NET Core 3.1 and .NET 5.0 in our products. More information is available here.Ready to explore version 2025.4?
The new version 2025.4 brings powerful updates to Reports, Dashboards, and PDF Forms. Build, visualize, and deliver your data with more flexibility and precision than ever before.Download a fully-functional 30-day trial and experience what’s new.