We are pleased to announce the release of version 2026.1 of Stimulsoft products for creating reports and dashboards! This new release includes support for the .NET 10 framework and the PDF/UA standard, expanded dashboard functionality, a new Amazon Redshift data source, the ability to run C# scripts in Reports.JAVA, and much more.
A list of the new features in version 2026.1

Support .NET 10
Starting with version 2026.1.1, Stimulsoft components fully support the .NET 10 platform. In addition to existing packages, libraries compiled for the .NET 10 framework are now provided. We continue to monitor the development of the .NET platform and guarantee compatibility with its new features.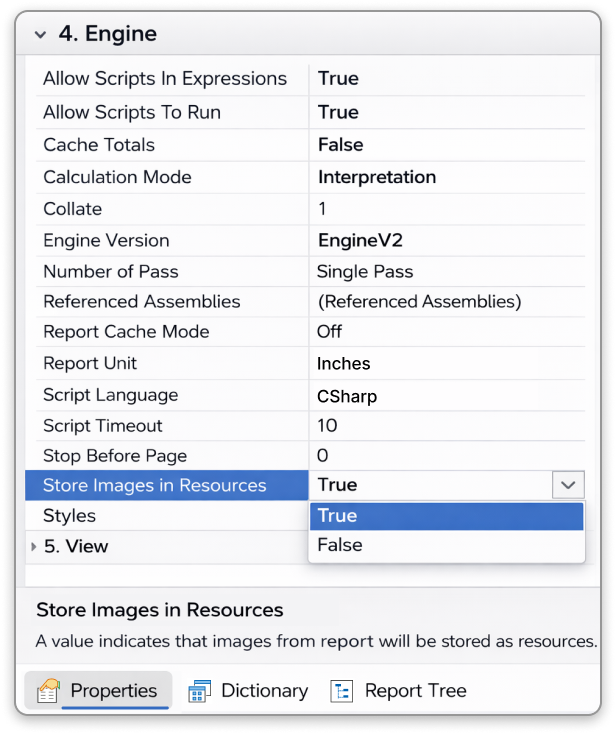
Stored images in resources
To prevent duplicate images in the rendered report, the Store Images In Resources property has been added. When this property is set to True, the report engine stores the image in resources and inserts a link to that resource into the Image component. When set to False, the image is stored directly within the report component.Slider mode for Number Box and Date Picker in dashboards
A Slider display mode has been added to the Number Box and Date Picker dashboard elements. Filtering data is now easier. To apply this, simply move the slider left or right. You can also use the sliders to adjust the range of desired values. The Slider display mode can be enabled in the element editor using the View Mode setting. Currently, this feature is available only for WinForms components, but we plan to add it to our other reporting tools in the future.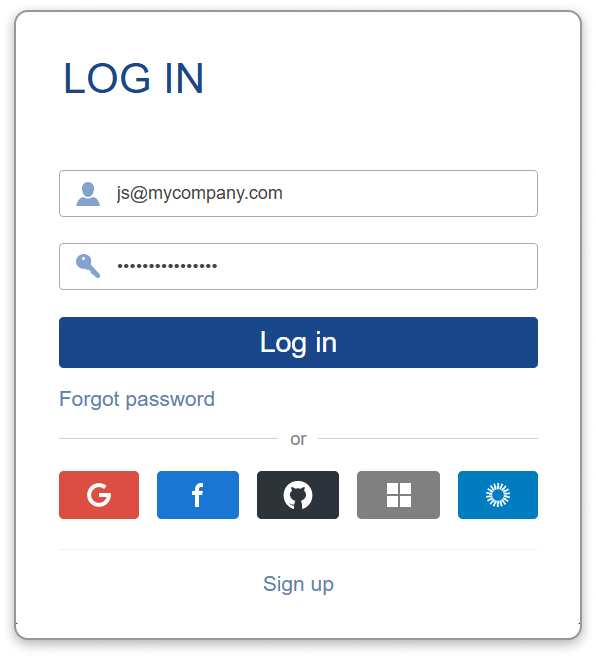
SSO login for Server
Stimulsoft Server now supports authorization and registration via external providers, including Google, Facebook, Microsoft, Azure AD, GitHub, and Okta. Single sign-on authentication scheme (SSO) is available both when running the server on Windows and when deployed in Docker. To use SSO, specify the provider parameters in the server configuration under Accounts.Editing Images in reports
The Image component now supports editing images in the rendered report. To enable this, set the Editable property to True. Then, you can activate editing mode in the viewer and replace the image in the component as needed.Amazon Redshift data source
We have added a new Amazon Redshift data source. To use this data source, select Amazon Redshift on the SQL tab of the New Data Source dialog. After you create a connection and run a query, you can build reports and dashboards based on the retrieved data.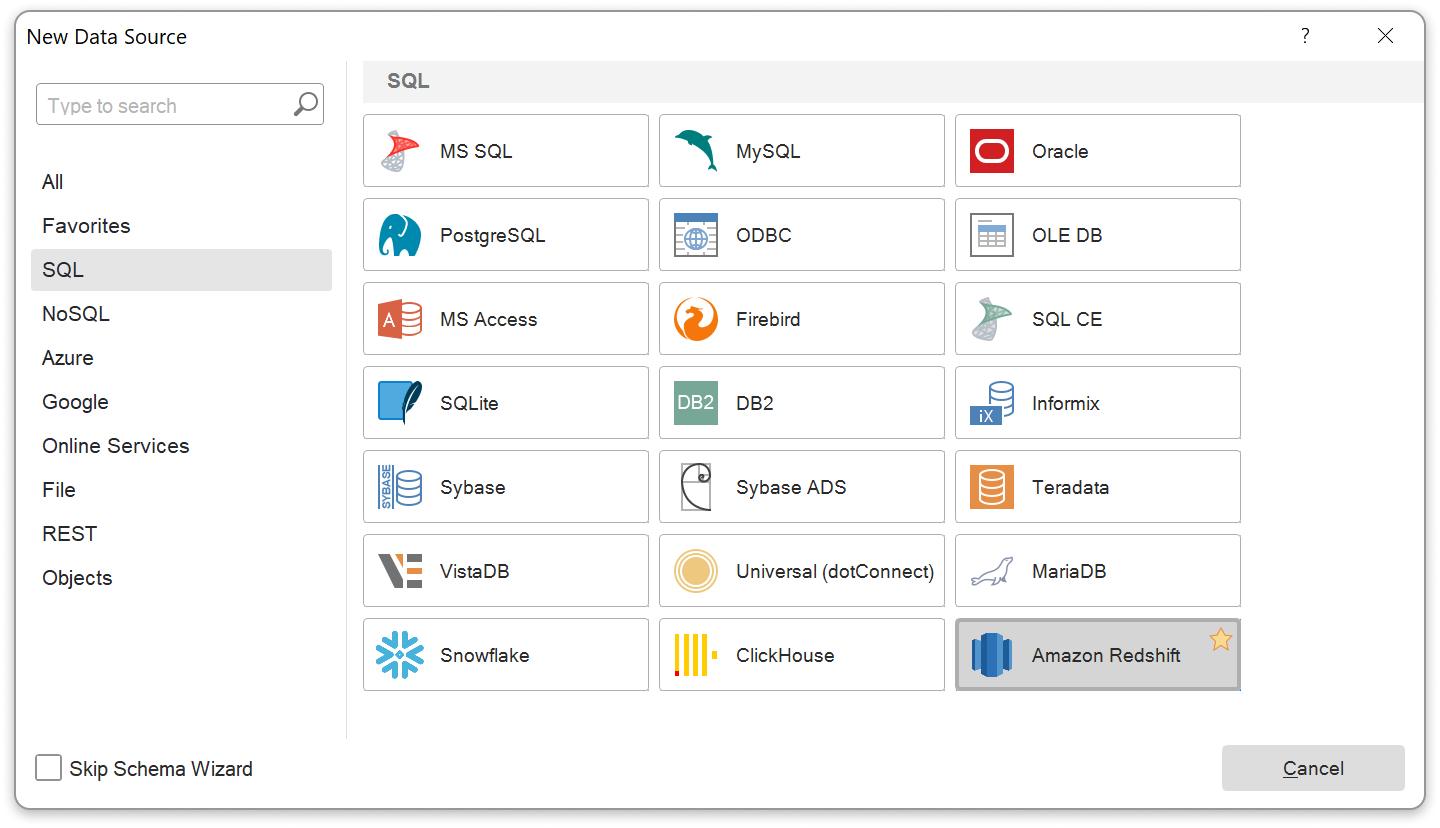

CSharp script in Reports.JAVA
Release 2026.1.1 adds support for executing C# scripts in Reports.JAVA. Scripts can now be used in report component expressions, variables, and calculated columns. Loops, recursion, arrays, and other C# language constructs are allowed. Script execution occurs only when a return operator is present. More details are available on our website.try/catch/finally in CSharp Parser
In the new version we have added support for the try/catch/finally construct when creating CSharp scripts. The try and catch blocks allow you to safely handle exceptions, while the finally block provides execution of operations regardless of whether an exception occurs.
Script security improve
C# scripts now have additional restrictions to enhance execution security. These restrictions apply to the number of loop iterations, recursion depth, maximum array size, and other potentially unsafe constructs. By default, the restrictions are enabled but can be disabled using the AllowUsingSecurityMode option. In Stimulsoft Designer, you can disable them via the Script Security option in the Options dialog box of the report designer.Stimul AI diagnostic data connection errors
Stimulsoft Designer now features error analysis using Stimul AI when connecting to data sources. When an error occurs, the system analyzes it and suggests possible solutions. You can also open a dialog with Stimul AI for further clarification.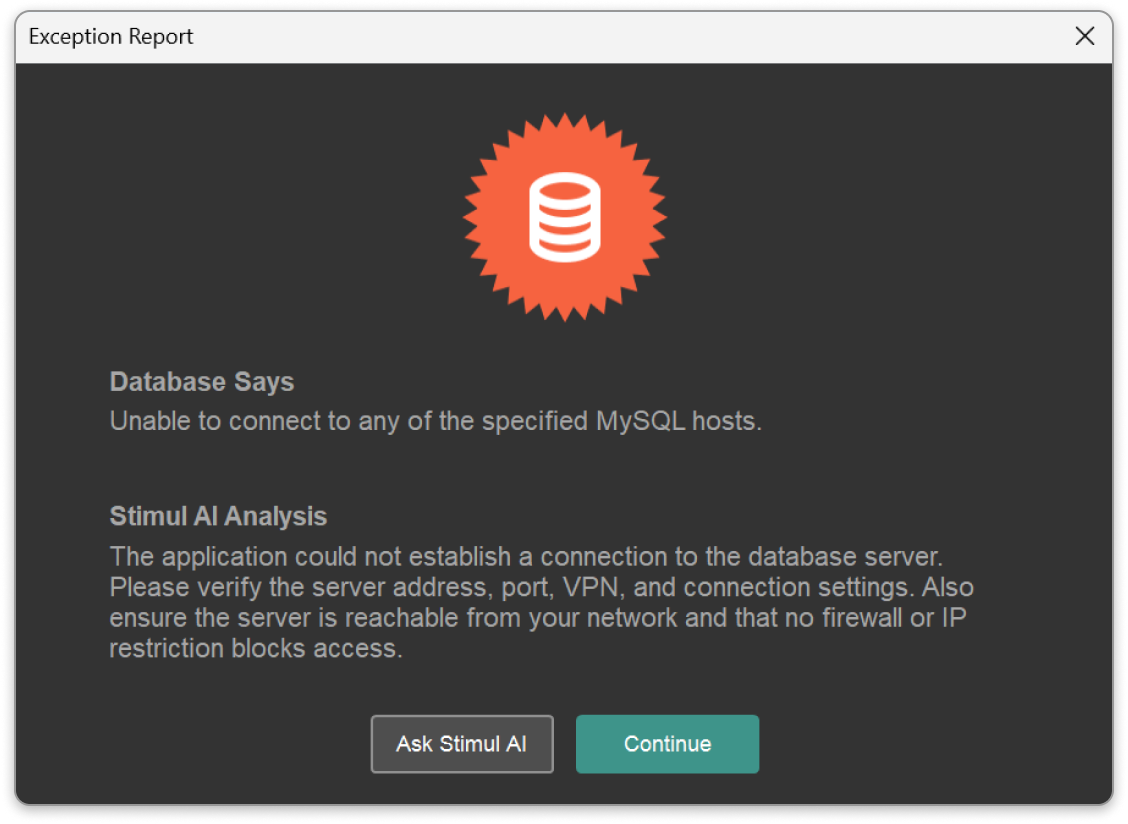
Data files in AI wizard
The AI Wizard now allows you to directly upload data files - JSON, XML, dBase, CSV, Microsoft Excel, and GIS formats - to create reports. Simply drag and drop the desired file into the wizard, and the AI Wizard will automatically analyze its structure and suggest a range of reports that can be created from the uploaded data.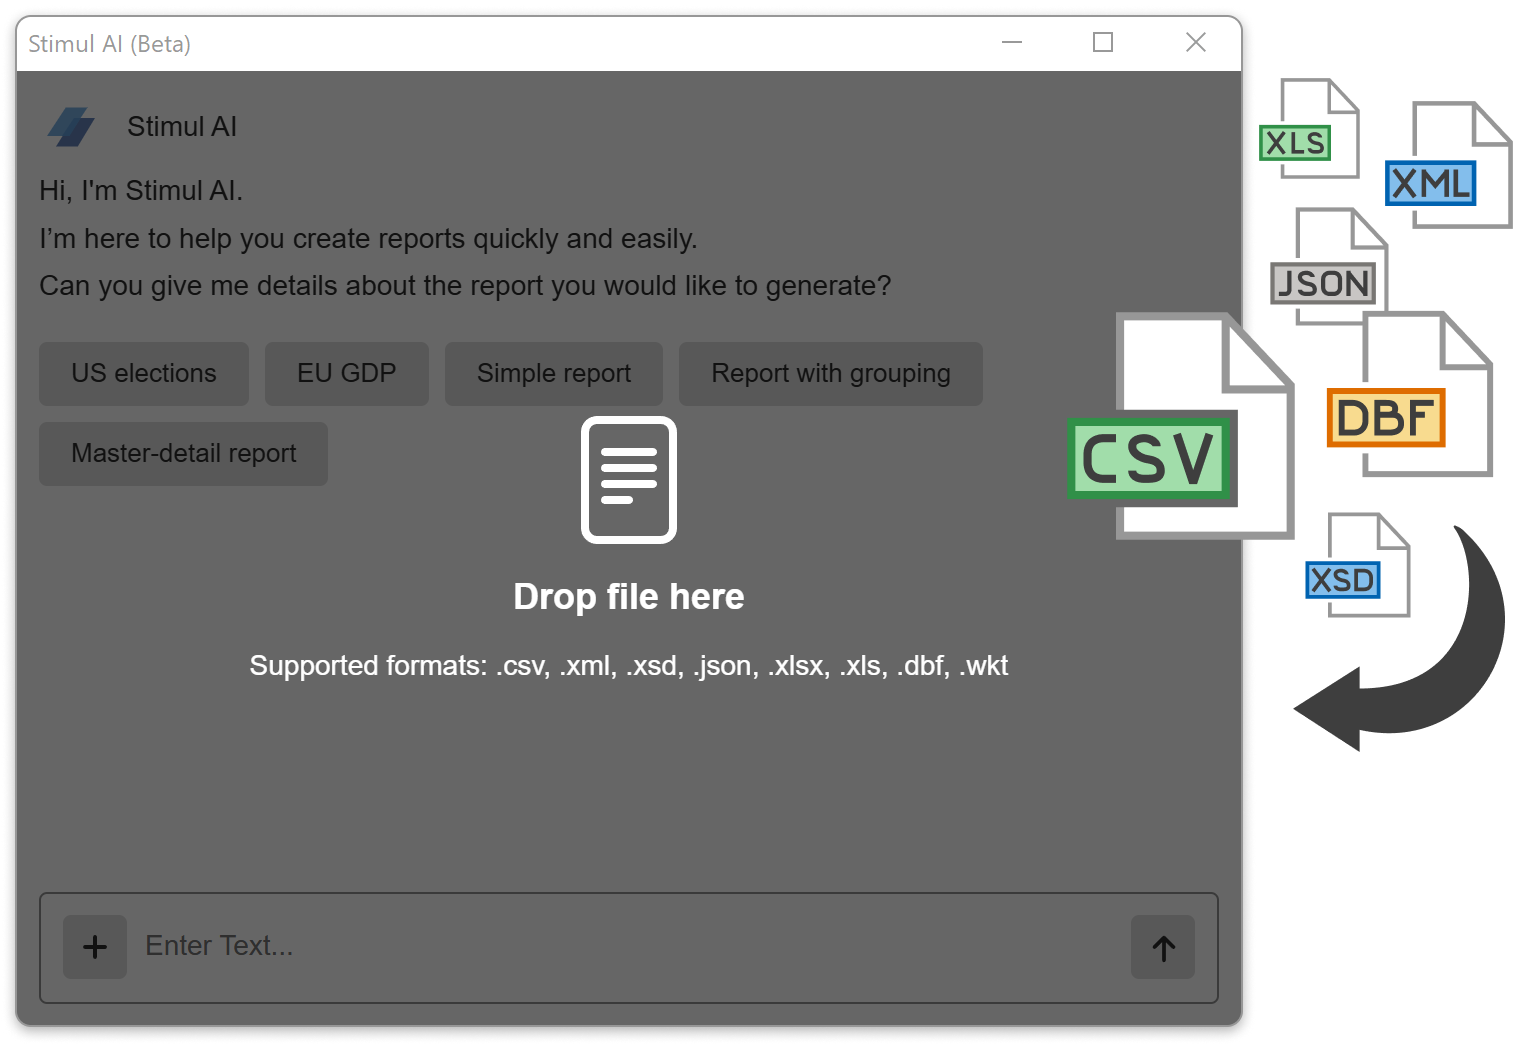
Multi columns list in parameters
Starting with release 2026.1.1, you can use a different number of columns for a single variable key. When expanding the list of parameter values, the labels are displayed in multi-column mode. Columns are configured in the variable editor, and multiple columns can be specified both when creating a list of items and when selecting multiple data columns for variable keys. This feature is available for Value variables.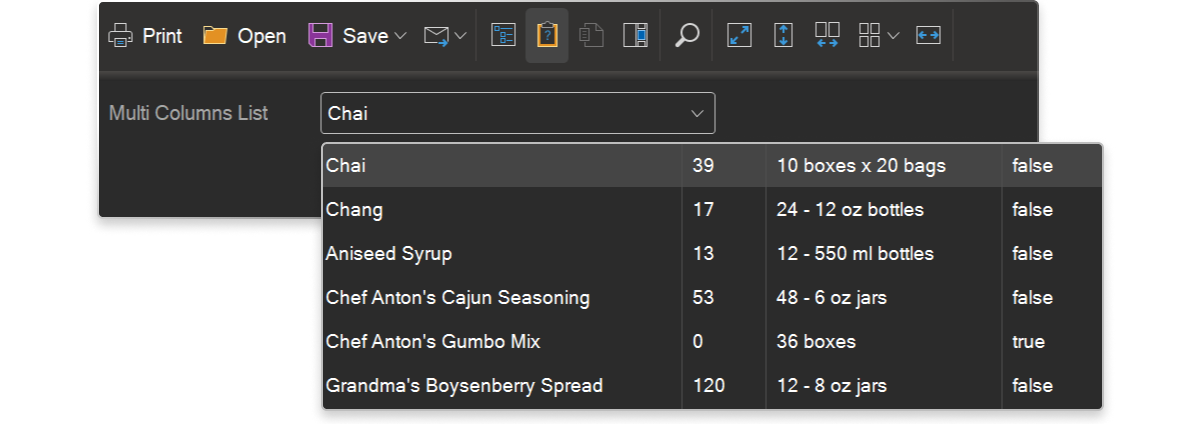
Variable labels in dashboards
Now, in dashboards, you can retrieve not only a variable's value but also its label. To do this, use the Label property, for example: {Variable.Label}.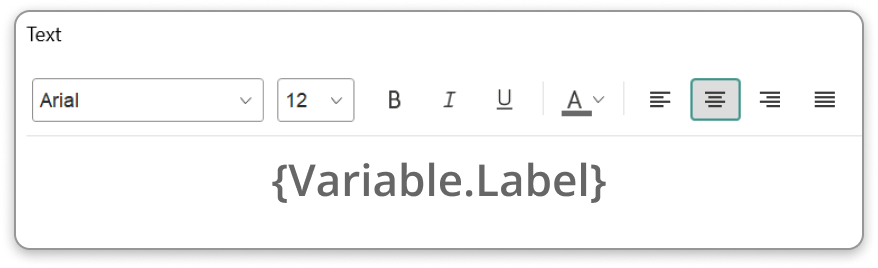
Tooltips in Pivot table
The Pivot Table element now has a tooltip setting for hovering over resulting cells. If a cell has a hyperlink assigned, it can also be displayed in the tooltip. This setting is configured in the data field interaction editor via the Mode parameter in the On Hover category.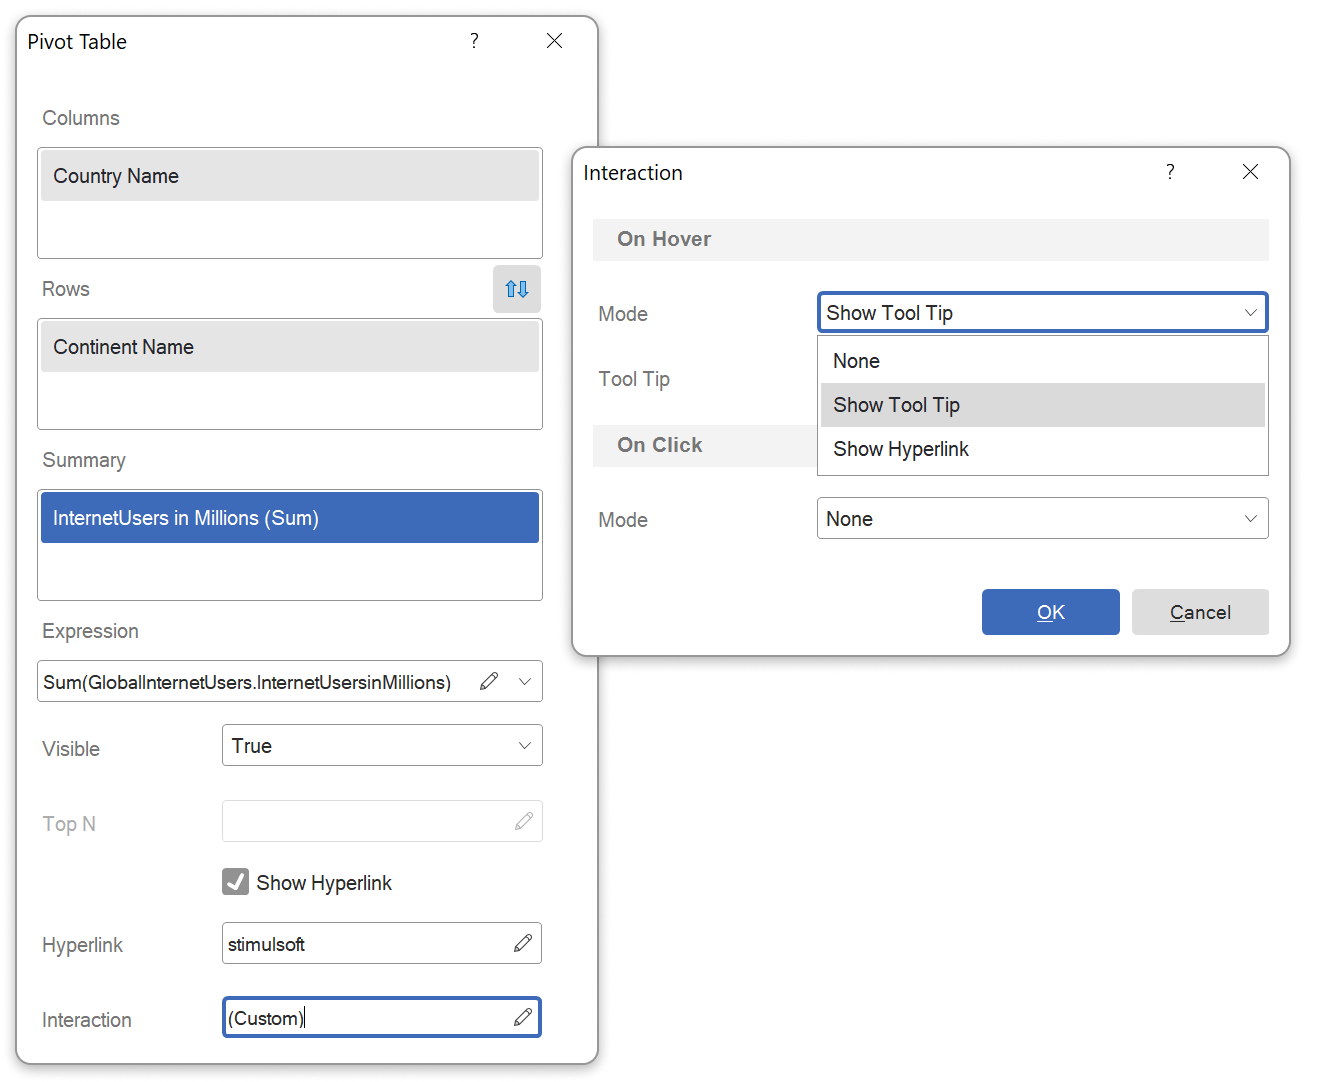


ZUGFeRD in Reports.JAVA
The long-expected ZUGFeRD standard for exporting reports to PDF in a Java environment is finally supported. This standard is designed for electronic invoices. When exported, the report is converted to a PDF/A-3 document, and an XML file containing the invoice data is embedded in the PDF.Font name localization
Localized font names can now be displayed in the Ribbon panel of the report designer. If a font contains localized versions of its name, the displayed name may depend on the designer's localization or the operating system's language settings. There is also an option to always display the font name in English. Localization is controlled in the Options window of the report designer using the Font Name parameter.
Support for PDF/UA
Our latest release introduces full support for the PDF/UA standard when exporting reports to PDF. Now exported documents meet universal accessibility requirements, providing proper display and navigation for users with disabilities.To take advantage of this functionality, report templates need to be updated with expressions added to component tags. These expressions define the logical structure of the report and additional attributes, so that exported PDFs include the correct tag structure, alternative text for images, and a proper element hierarchy.
Identifier editor for the Tag field
We have added a new editor for creating and editing tags in reports. The Insert menu of this editor contains basic tag templates. The new tag editor can be accessed from the Interaction menu, in the tag field.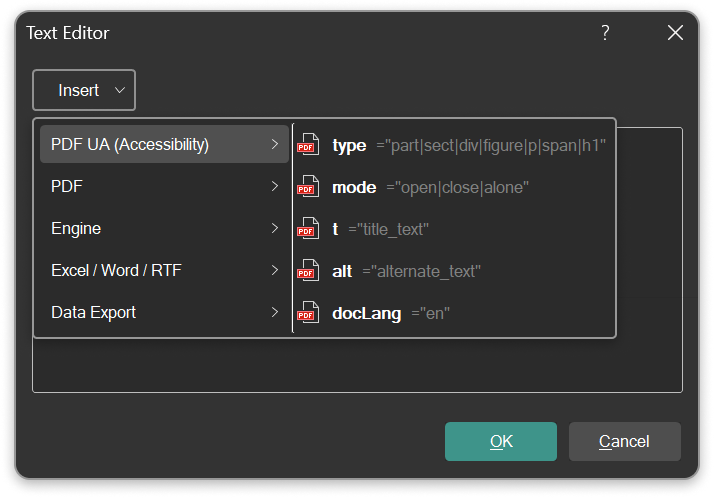
Ready to explore version 2026.1?
The new version 2026.1 brings powerful updates to Reports and Dashboards. Build, visualize, and deliver your data with more flexibility and precision than ever before.Download a fully-functional 30-day trial and experience what’s new.