Every year, at Stimulsoft, we highlight the most significant innovations and improvements to our products.


Let's start with AI - the key theme of 2025
The Stimul AI assistant was introduced into our products in 2024, and in 2025 we continued to advance in this direction. The assistant learned to generate data, create reports from a single user text request, and analyze errors when connecting to data sources.AI-driven data generation
In the WinForms Stimulsoft Designer for desktop, you can now generate data using Stimul AI. Navigate File > New > Get Data and click Generate Data with AI, then enter a prompt query or select one from the examples. This feature is available only if the Show ‘Stimul AI’ option is enabled in the report designer settings. Otherwise, sample data will be retrieved from a file.AI wizard
Stimulsoft Designer now supports an AI assistant for report creation. Users can generate reports from connected data sources using a single text query. The assistant supports simple lists, grouped reports, master-detail reports, and reports with columns. You can further improve the report’s design using a custom query. The AI wizard can be disabled using the Show ‘Stimul AI’ option in the Options window of the report designer.AI-based error diagnostics
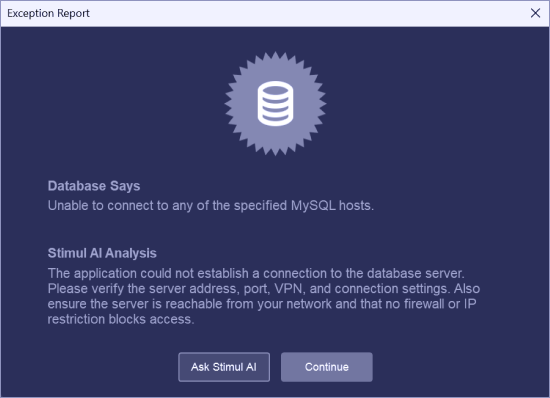
In Stimulsoft Designer we implemented error analysis using Stimul AI when connecting to data sources. When an error occurs, the system analyzes it and suggests possible solutions. You can also open a dialog with Stimul AI for additional details.Using C# scripts
In one of the new 2025 releases, we added the ability to run C# scripts in interpreted mode during report calculation. This functionality is available in Reports.NET, Reports.WEB, Reports.JS, and Reports.JAVA. We also implemented support for try/catch/finally constructs when creating C# scripts and introduced additional restrictions to improve execution security.
New capabilities
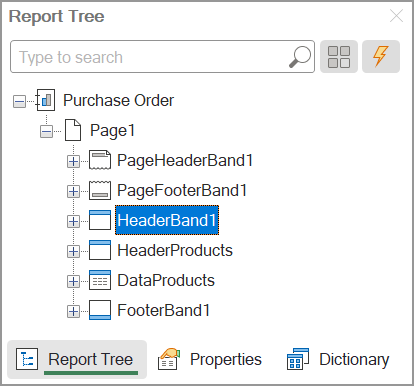
Dragging in the report tree
The Web and JS report designers now support drag-and-drop functionality for components in the Report Tree panel. The component hierarchy determines their processing order during report generation. This allows you to easily change the processing order of components or move a component within the tree.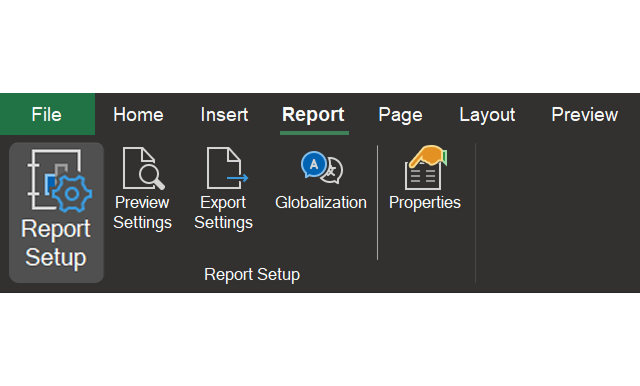
The Report tab in the designer
A new Report tab has been added to the report designer. This tab contains the main report template management commands, such as Report properties, Preview settings, Export options, Globalization, as well as a command to switch the properties panel to the report properties.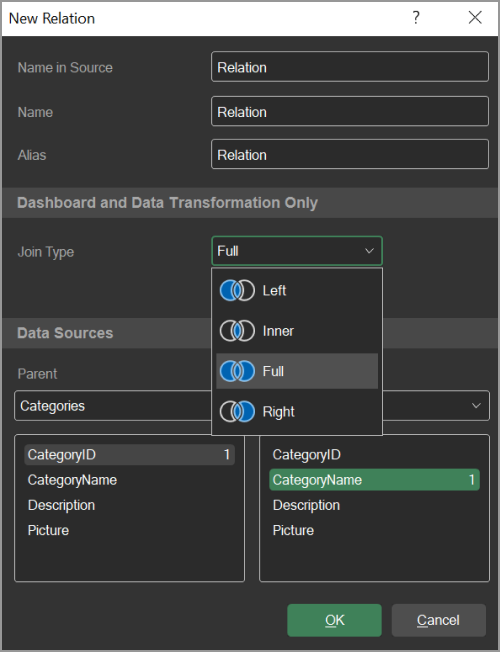
Data join type for dashboards and data transformations
We have added the ability to choose the join type between two data tables when building dashboards and performing transformations. The join type defines how records from the tables are matched and merged to form the final dataset. This directly affects the composition of the sample, the behavior of groupings, and the results of subsequent calculations.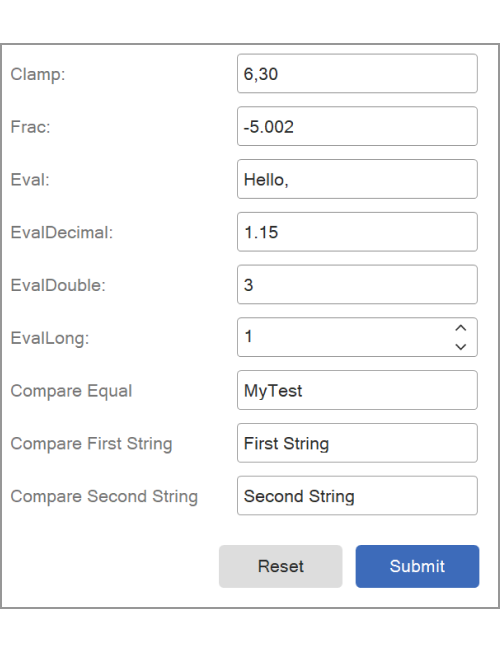
New dictionary functions
New functions have been added to the data dictionary and can be used in reports and dashboards: Clamp() - allows specifying the range of the return value, Frac() - returns the fractional part of the passed argument, Eval() - evaluates an expression in the context of a given report and returns its result, and Compare() - compares two string values and returns the comparison result as a number.Parameters and variables
In 2025, numerous changes were made to parameters and variables. For example, the ability to filter variable values in the viewer’s parameters panel was added, along with a new PageLine system variable and the option to change the ‘Not assigned’ status for all variable data types in the parameters panel.Regarding report and dashboard parameters, they can now be displayed in a dialog box before appearing in the viewer. Starting with version 2026.1.1, it became possible to use multiple columns for a single variable key. In this case, when expanding the list of parameter values, the labels are displayed in multi-column mode.

New charts
Stimulsoft products now feature two new charts:
Surface chart
A three-dimensional chart that displays data as a surface (grid) showing the relationship between three variables.
3D Area chart
Allows you to display values like in an Area chart, but in a 3D projection with depth and perspective for improved comprehension and analytics.
Stimulsoft Server
Last year, we introduced the ability to run Stimulsoft Server in a Docker container, along with a new tool for safely migrating the reporting server from one host to another.Reports.JAVA

Blockly
The Java reporting tool now supports Blockly for creating event scripts in reports. With Blockly, you can visually design scripts without writing any code. Scripts created using Blockly are universal across all our report engines, allowing reports to work on any platform.
ZUGFerD
The long-expected ZUGFeRD standard for exporting reports to PDF in a Java environment is finally supported. This standard is designed for electronic invoices. When exported, the report is converted to a PDF/A-3 document, and an XML file containing the invoice data is embedded in the PDF.Filter elements in dashboards
For filter elements in dashboards, the ability to set a limit on the number of values selected at the same time and the element display mode as a Slider has been added.In addition to the major updates, we delivered several minor but no less important enhancements:


Want to learn more?
We’ve shared only the key highlights of the year. Full details are already available in the news.To explore the product’s capabilities, download the free 30-day trial version.