


We continue our series of articles on Data Transformation in Stimulsoft products. Previously, we covered joining tables and calculating running totals. In this article, we will look at data grouping and show how it can be used to obtain aggregated values for reports and dashboards.
As an example, we will use the Chart on Data Band report and the product and category data it contains.
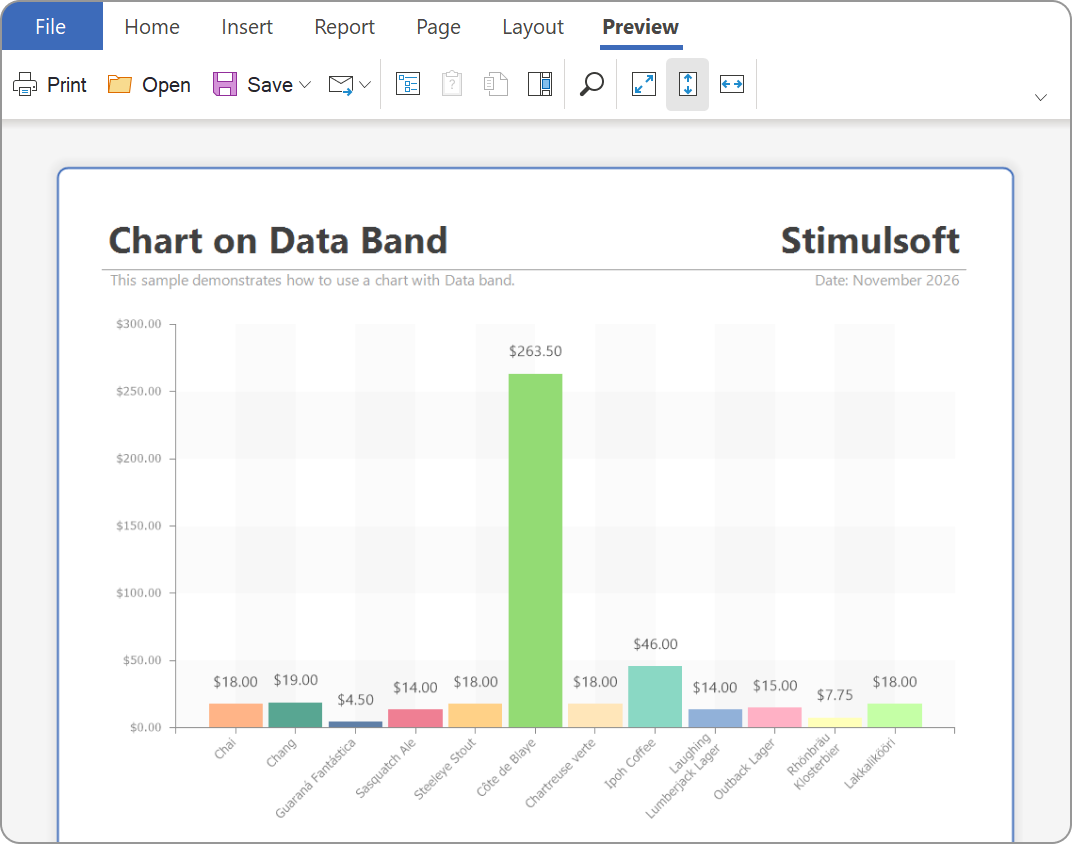
For example, the data source may contain information about the stock levels of individual products, while we need to obtain the total quantity of products for each category. This task can be performed directly at the data source level, for example, using an SQL query. However, Data Transformation allows you to group the data directly in the reporting tool without modifying the original query.
For example, if you use the CategoryID category identifier as a dimension and UnitsInStock, which stores the number of product units in stock, as a measure and apply the Sum function, you can obtain the total number of product units in stock for each category. You can use multiple dimensions for grouping. For example, data can first be grouped by category and then by individual products within that category.
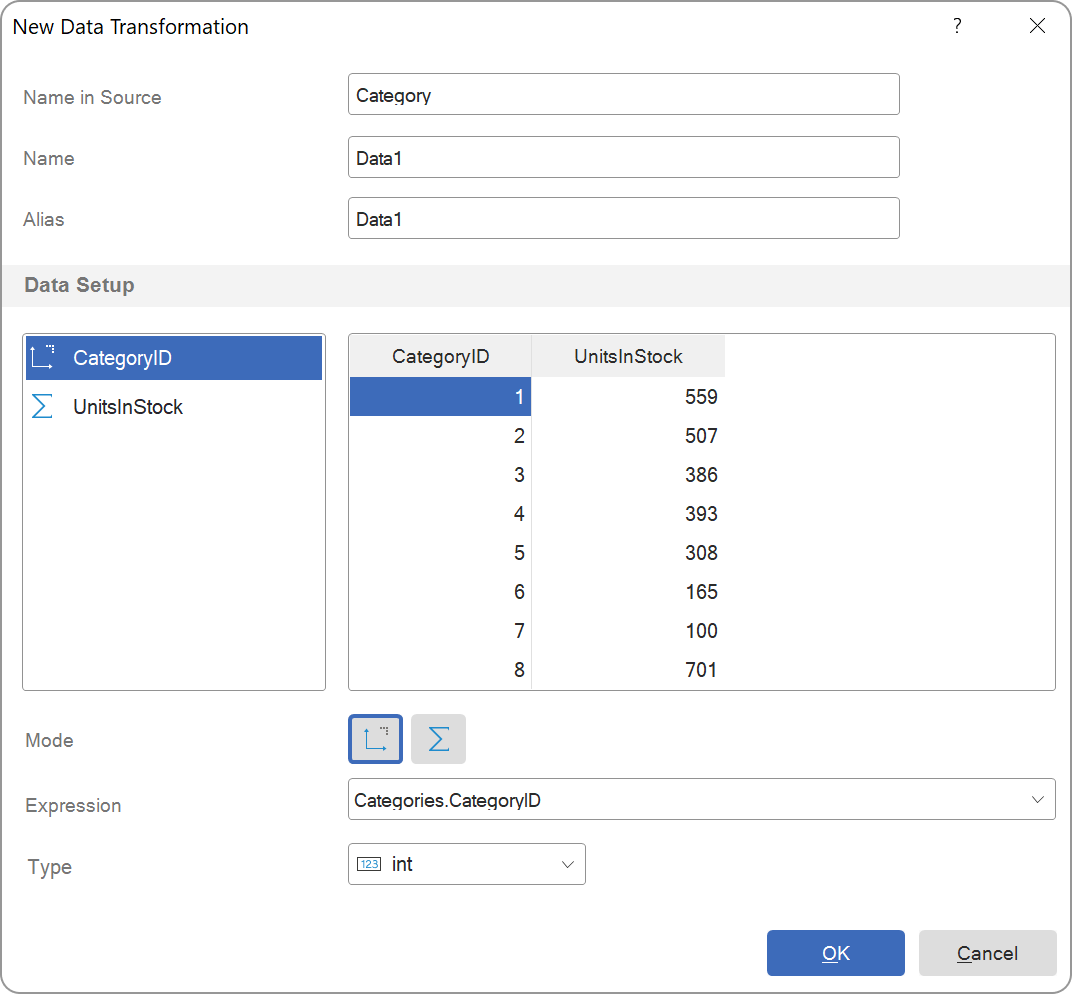
Add the CategoryID and UnitsInStock fields to the transformation. Set CategoryID to Dimension and UnitsInStock to Measure. For the UnitsInStock measure, select the Sum aggregation function. The data will then be grouped by CategoryID, and the sum of UnitsInStock will be calculated for each category.
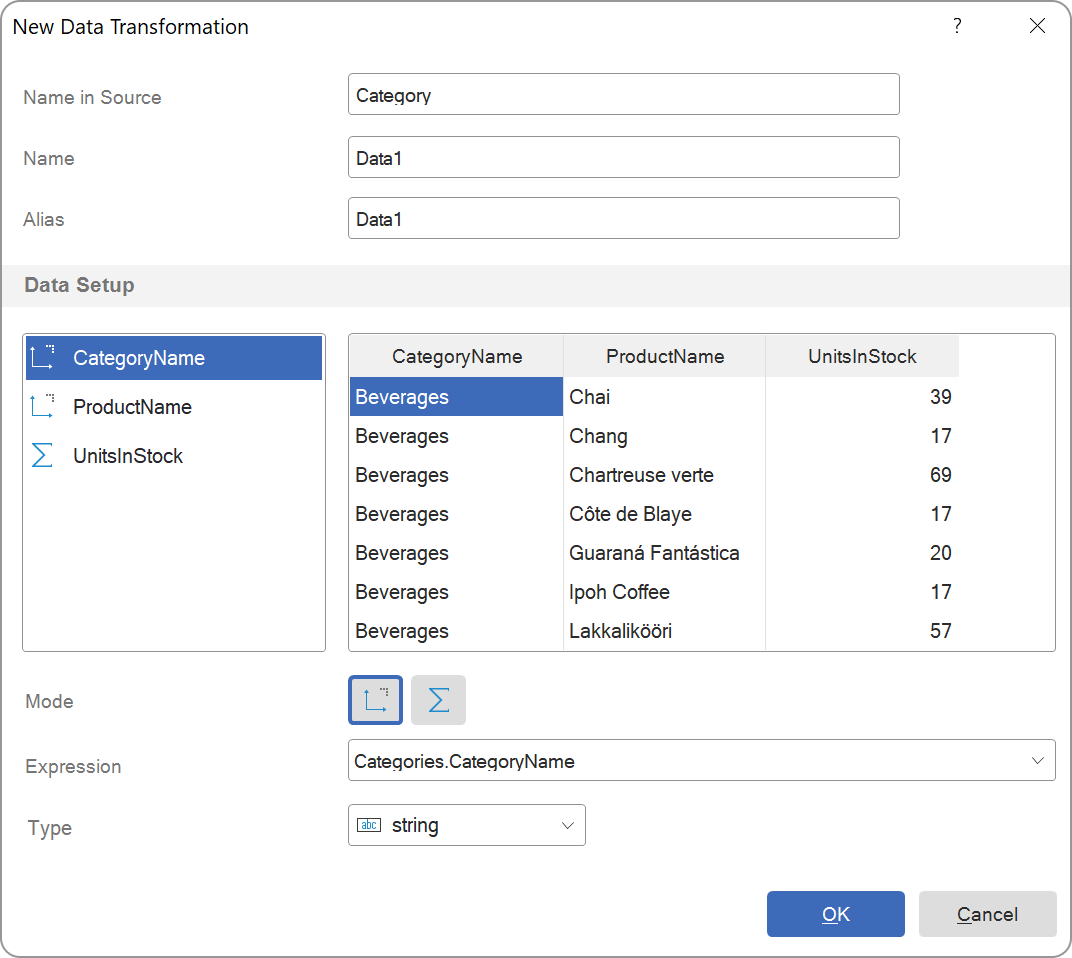
Add the CategoryName, ProductName, and UnitsInStock fields to the transformation. Set CategoryName and ProductName to Dimension, and UnitsInStock to Measure. For UnitsInStock, use the Sum function. As a result, the data will be grouped by products within their respective categories.
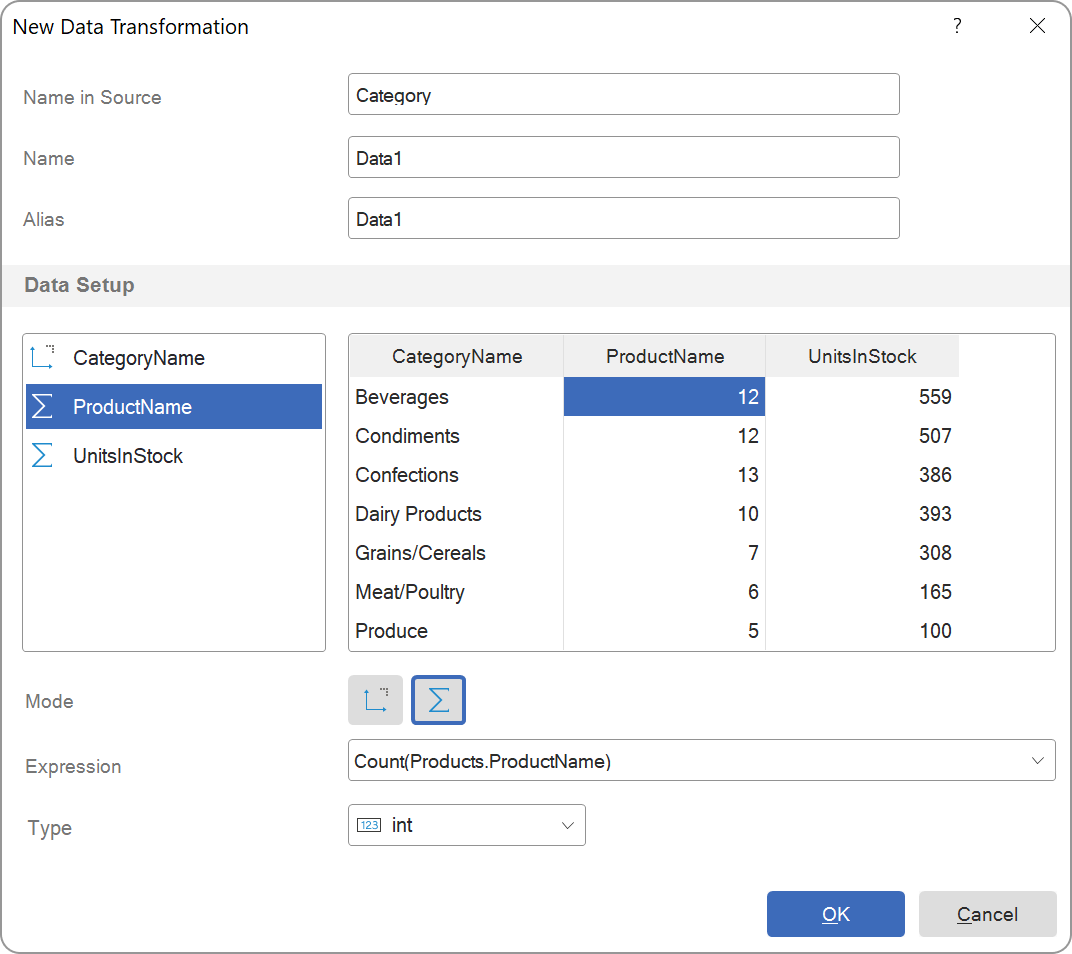
To obtain the next level of grouping, switch ProductName from Dimension to Measure and apply the Count function to it. CategoryName will remain the only dimension, while UnitsInStock will remain a measure with the Sum function. As a result, for each category you can obtain the number of products it contains and their total quantity in stock. For example, in our case the Beverages category contains 12 products and 559 units in stock.
Thus, by changing the set of dimensions, you can control the level of detail in the grouped data.
For example, the data source may contain information about the stock levels of individual products, while we need to obtain the total quantity of products for each category. This task can be performed directly at the data source level, for example, using an SQL query. However, Data Transformation allows you to group the data directly in the reporting tool without modifying the original query.
How data grouping works
Data grouping uses two types of fields: Dimension and Measure. Dimensions define the values by which data is grouped, while measures contain the data that is aggregated within each group.For example, if you use the CategoryID category identifier as a dimension and UnitsInStock, which stores the number of product units in stock, as a measure and apply the Sum function, you can obtain the total number of product units in stock for each category. You can use multiple dimensions for grouping. For example, data can first be grouped by category and then by individual products within that category.
Grouping in Data Transformation
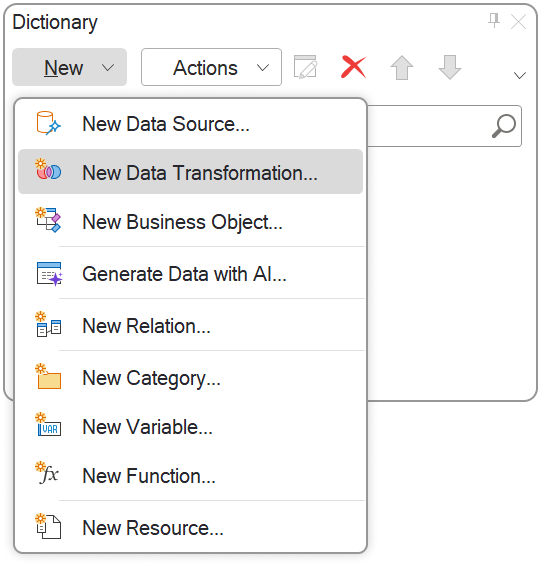
Open the Dictionary tab, click the New button, and select the New Data Transformation command.Add the CategoryID and UnitsInStock fields to the transformation. Set CategoryID to Dimension and UnitsInStock to Measure. For the UnitsInStock measure, select the Sum aggregation function. The data will then be grouped by CategoryID, and the sum of UnitsInStock will be calculated for each category.
Multiple levels of grouping
If necessary, you can make the grouping more detailed by using multiple dimensions. In this example, the Products and Categories tables are related. This means that a single transformation can use the CategoryName category name from the Categories table together with product data from the Products table.Add the CategoryName, ProductName, and UnitsInStock fields to the transformation. Set CategoryName and ProductName to Dimension, and UnitsInStock to Measure. For UnitsInStock, use the Sum function. As a result, the data will be grouped by products within their respective categories.
To obtain the next level of grouping, switch ProductName from Dimension to Measure and apply the Count function to it. CategoryName will remain the only dimension, while UnitsInStock will remain a measure with the Sum function. As a result, for each category you can obtain the number of products it contains and their total quantity in stock. For example, in our case the Beverages category contains 12 products and 559 units in stock.
Thus, by changing the set of dimensions, you can control the level of detail in the grouped data.