




















We are happy to introduce version 2026.3 of Stimulsoft Reports, Dashboards, and PDF Forms! The new version features a Vue.js viewer for .NET, multiplayer report editing, autocompletion in the report designer, new Polar charts, AI-powered report editing, and much more.
A list of the new features in version 2026.3
Report viewer for Vue.js
Stimulsoft Reports for Vue provides a ready-made solution for displaying reports in Vue.js applications. The component supports viewing, printing, exporting, and a full set of interactive features, including drill-down, interactive sorting, group collapsing, and more. The client-side component is distributed as npm packages, and the server-side component is distributed via the NuGet package Stimulsoft Reports for Vue.js. It is included in the Stimulsoft Reports.WEB product.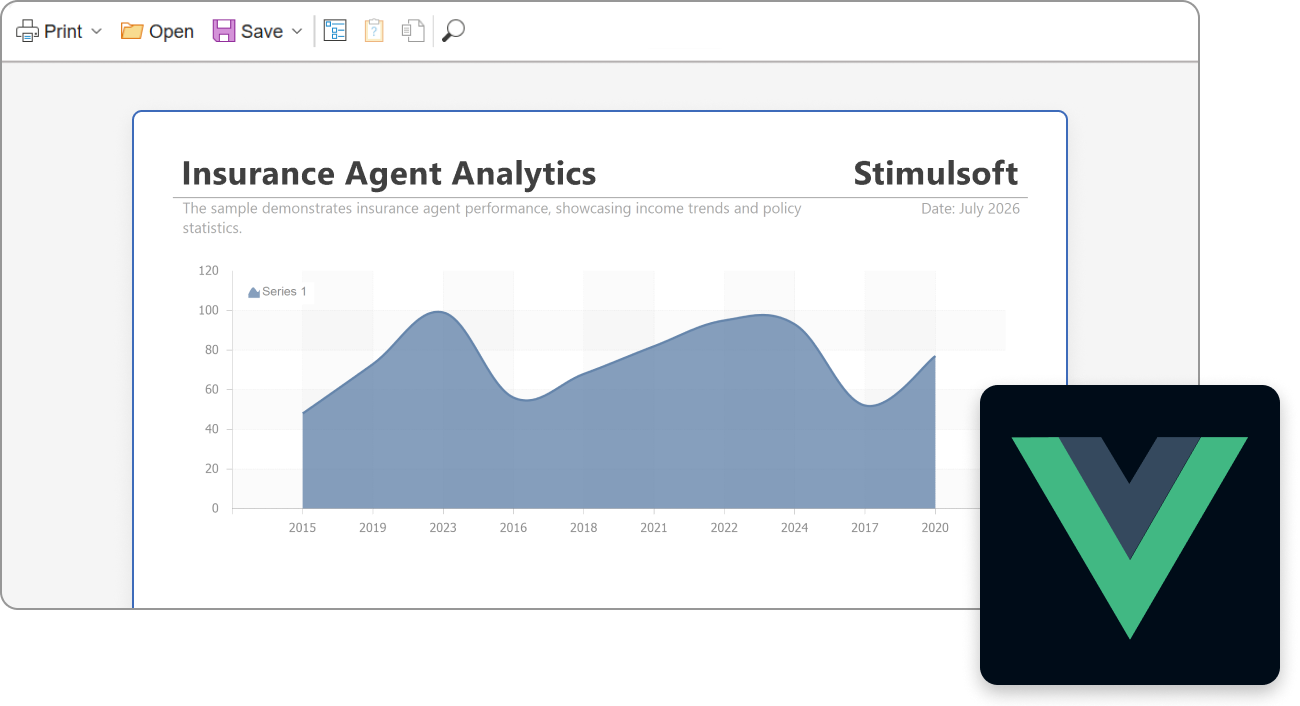
Auto-editing with AI
The Standalone Designer now includes a built-in AI assistant for report editing. Using natural language commands, developers can create, modify, and delete report components; customize pages; manage variables, resources, and user-defined data dictionary functions; as well as change styles and interactivity settings.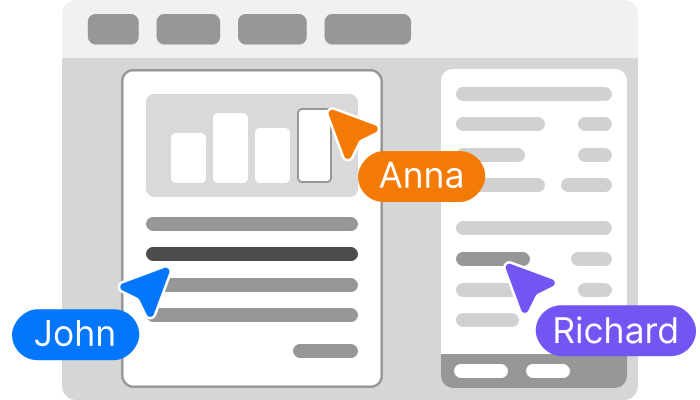
Multiplayer collaboration
The Stimulsoft Designer at designer.stimulsoft.com now supports real-time shared report editing. Several users from the same workspace can simultaneously work on the same report, see each other's presence, participant avatars, and changes made by other users. This feature is available with an active Team subscription and higher.IntelliSense for Stimulsoft Designer
Full IntelliSense support is now available in the Standalone Designer for Windows. The editor now supports syntax highlighting for C#, VB, and SQL, intelligent autocompletion, tooltips with documentation, method signature hints, and other features. Autocompletion has been added to the expression and SQL query editor. Additionally, text search and replace have been added to the expression editor.Polar and Polar Stacked charts
New chart types - Polar and Polar Stacked - have been added to reports and dashboards. These charts are designed for visualizing cyclical and multidimensional data in a polar coordinate system. The Polar Stacked chart also enables users to display accumulated values and compare the contribution of individual series.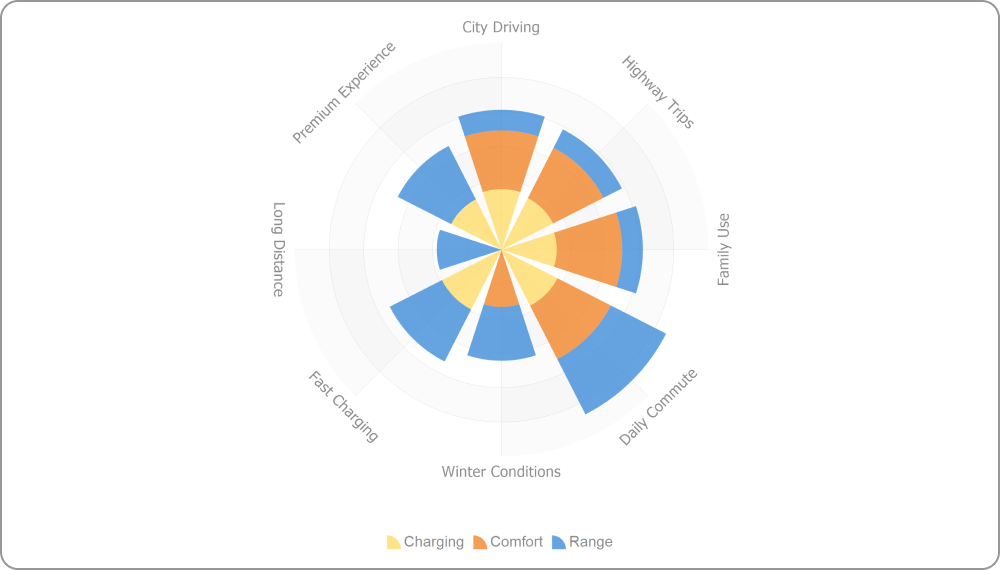
Data Bar types in Conditions
The Data Bar conditional formatting has received new display options. Now, the Data Bar can be displayed as a Rectangle, Arrow, or Banner, allowing you to choose the most appropriate data visualization method. You may configure the display type in the Conditions editor.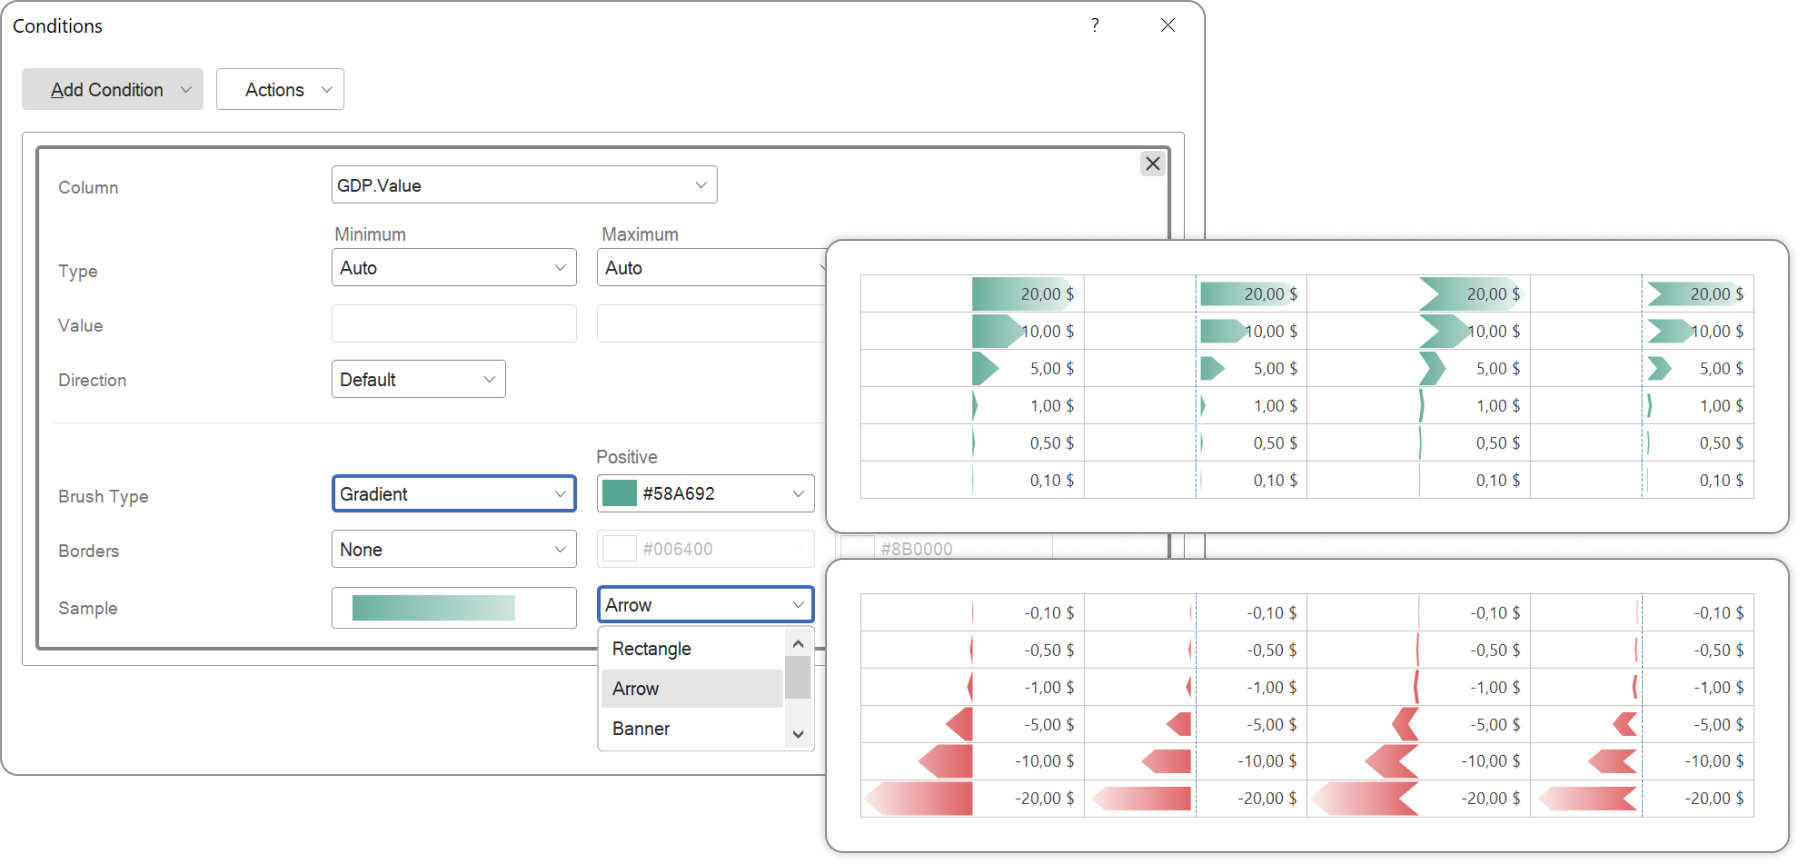
AI tuning for SMTP settings of scheduler
Stimul AI now helps you configure the SMTP server for the scheduler directly from the Options window of Standalone Designer. Simply describe the desired configuration in natural language, and the AI will automatically suggest the required connection parameters and guide you through the setup process step by step. Popular SMTP providers are supported, including Gmail, Outlook, Microsoft 365, Yahoo, and custom SMTP servers.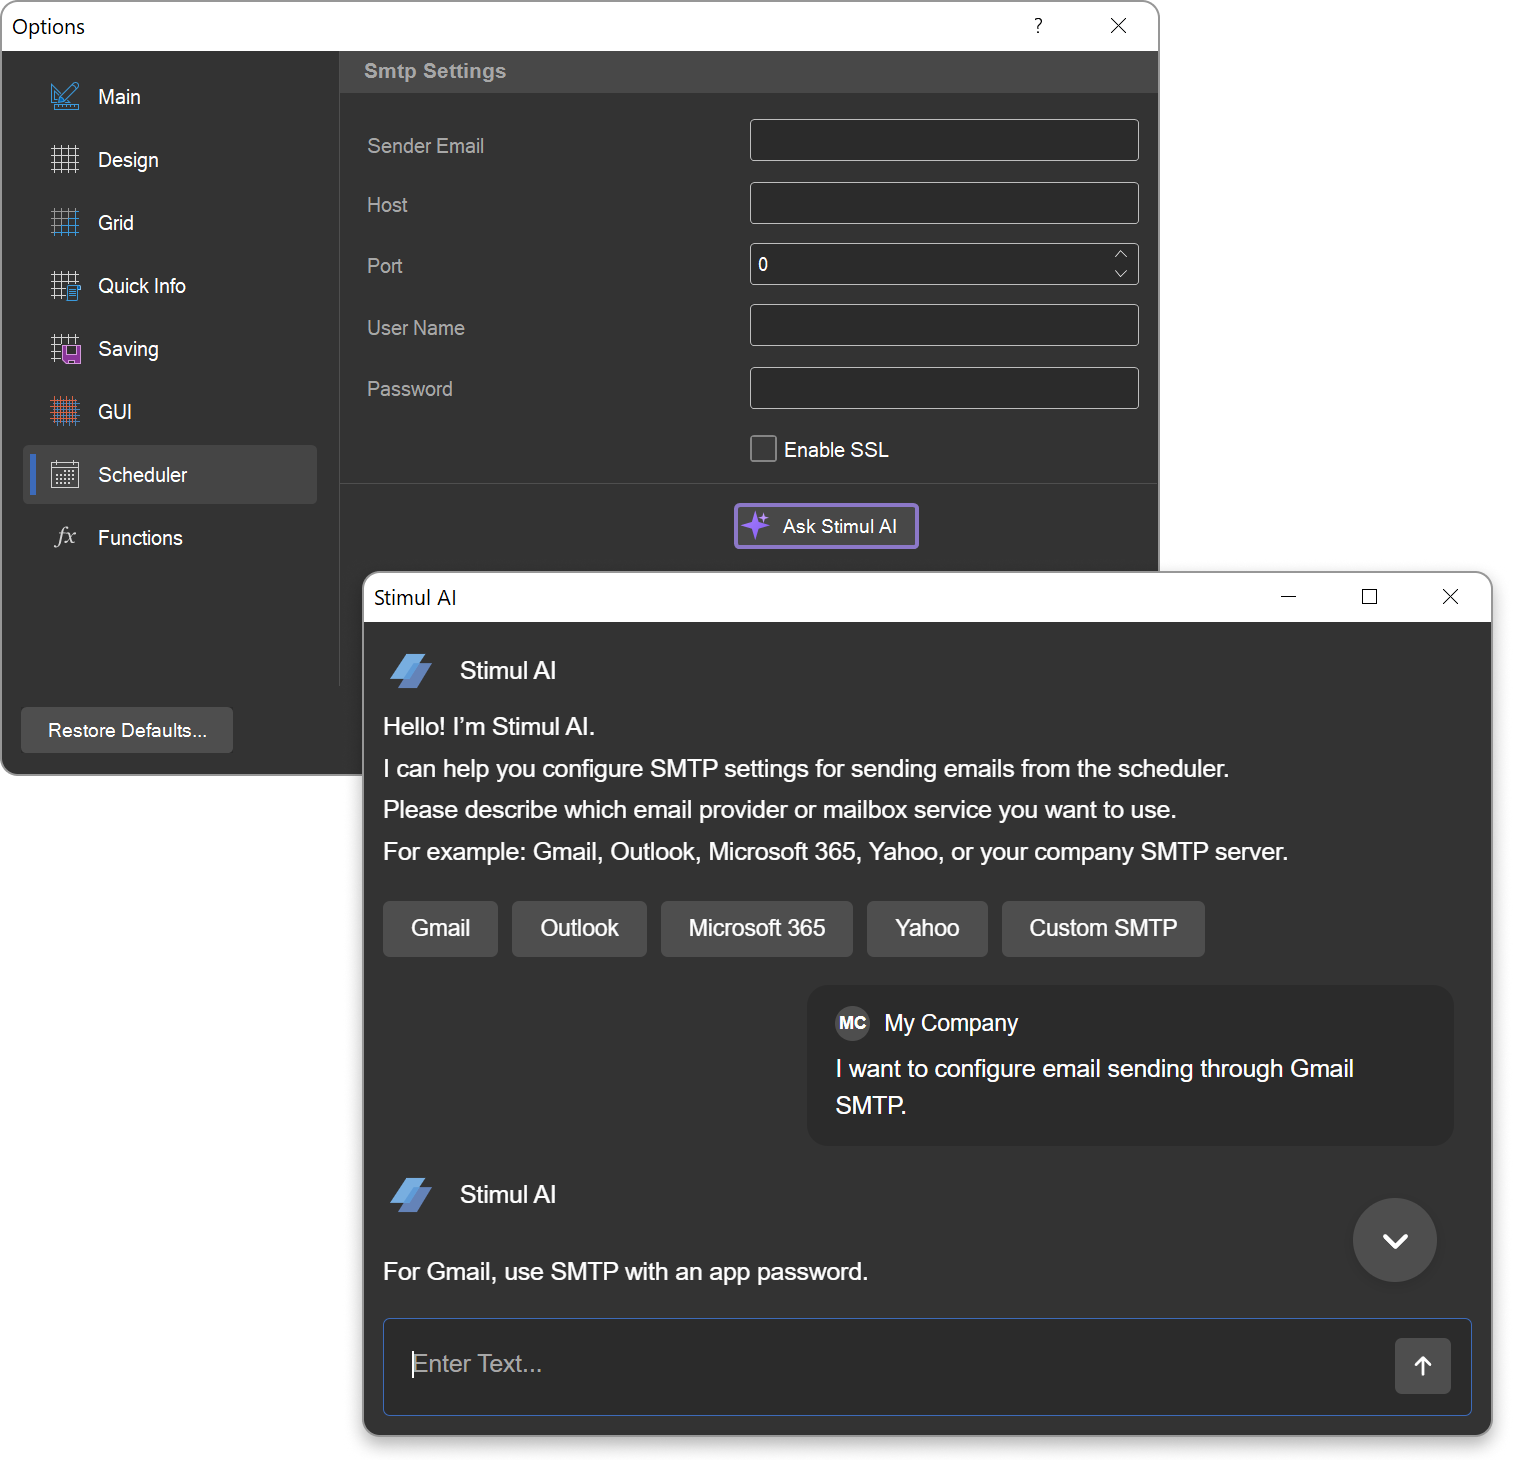
AI-assisted variable validation
You can now use Stimul AI when configuring variable validation with regular expressions. Simply describe the validation rule in natural language, such as "integers only," "email address," or "phone number," and the AI will automatically generate the corresponding regular expression. This significantly speeds up the validation setup process and helps eliminate errors when creating complex patterns.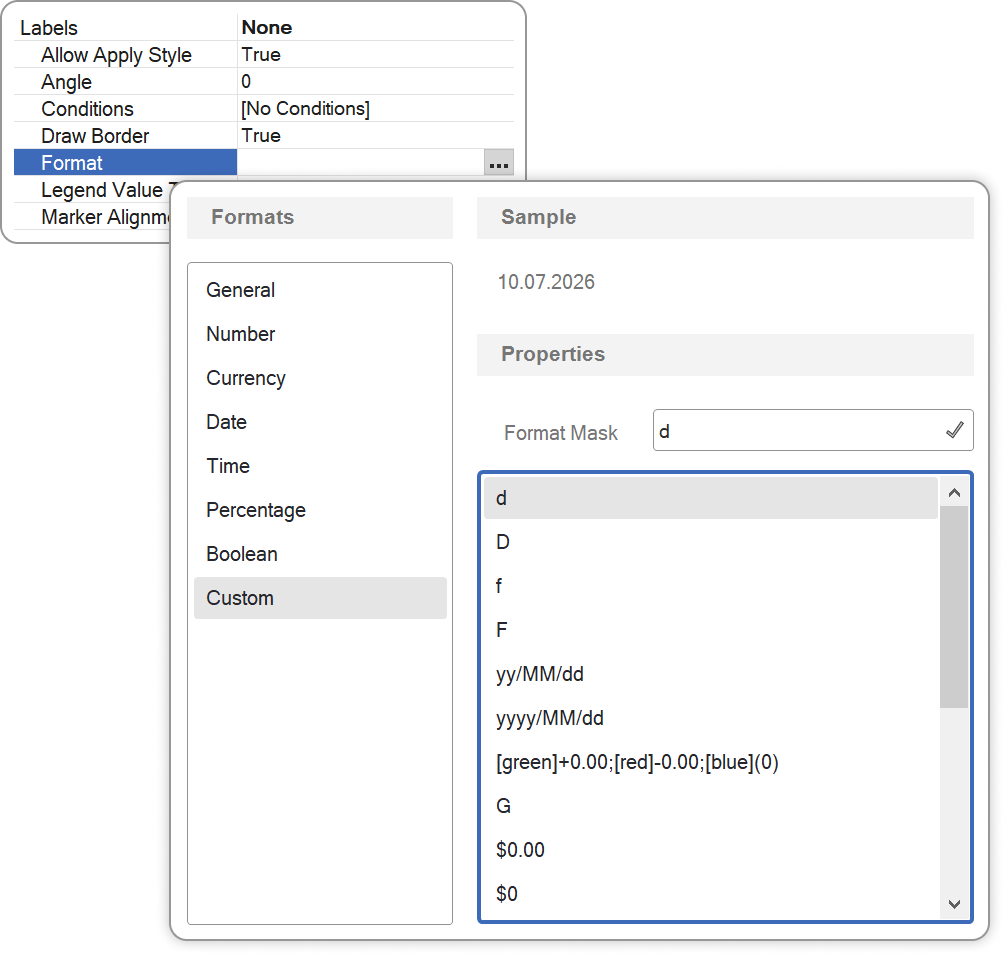
Limit of selected items
The List type variables now support limiting the number of selectable values. The maximum number of selected items can be configured using the Max Selected Items property in the Validation menu. Setting the value to 0 disables the limit. This feature is available for lists with the Allow user Values option disabled.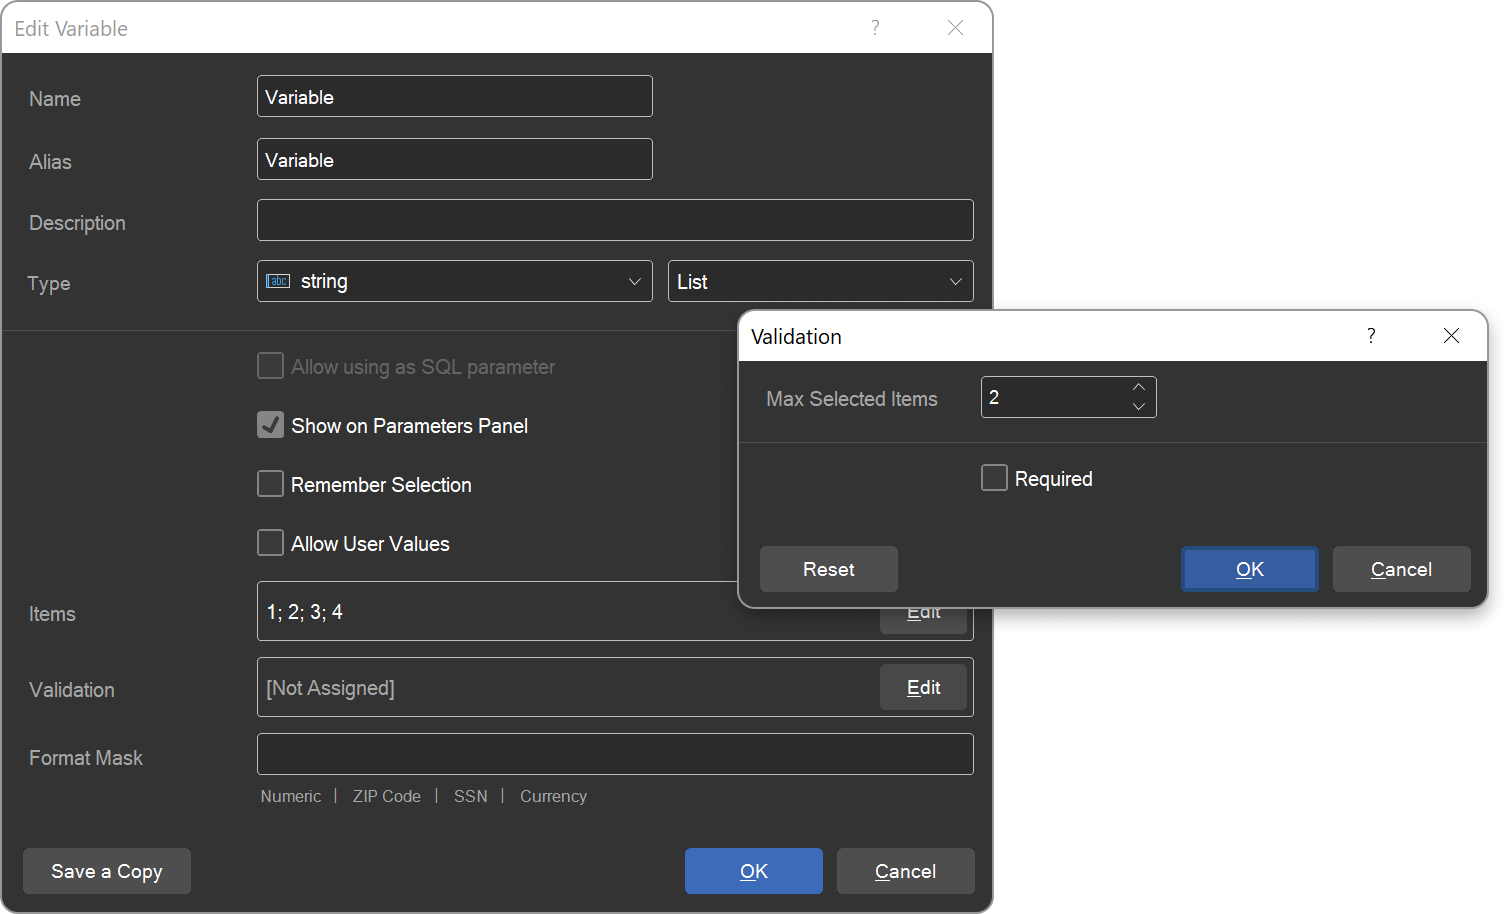
Function Test Execution
When creating or editing custom functions, you can now test them directly in the editor. If a function has arguments, you will be given the option to enter their values. The reporting tool will then execute the function and display the result. This allows you to quickly verify the implementation without running the report.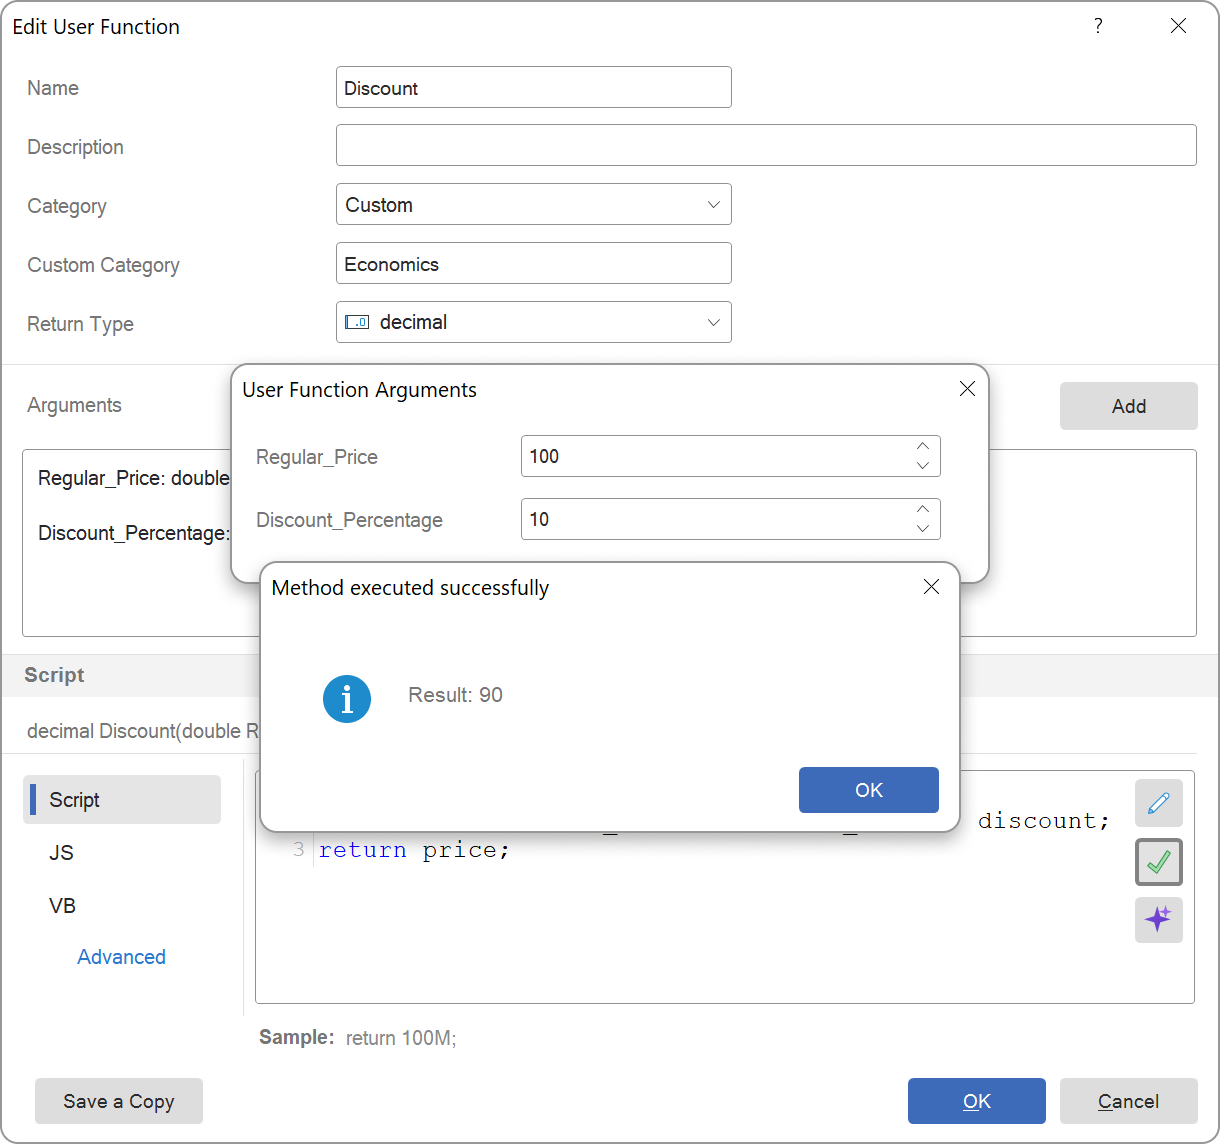
User functions from assemblies
User functions can now be registered directly from compiled assemblies. Once registered, these functions become available in the data dictionary and can be used in expressions and reports just like built-in functions. Assemblies can be placed next to the Stimulsoft Designer executable file or connected through the Functions section in the Options window of the report designer.Backup and restore in Stimulsoft Server
Stimulsoft Server now includes a built-in backup and restore tool. It supports MySQL, Microsoft SQL Server, PostgreSQL, and SQL CE databases, keeping all server content, including reports, dashboards, settings, and other objects. The backup and restore tool is available from the Server Controller context menu.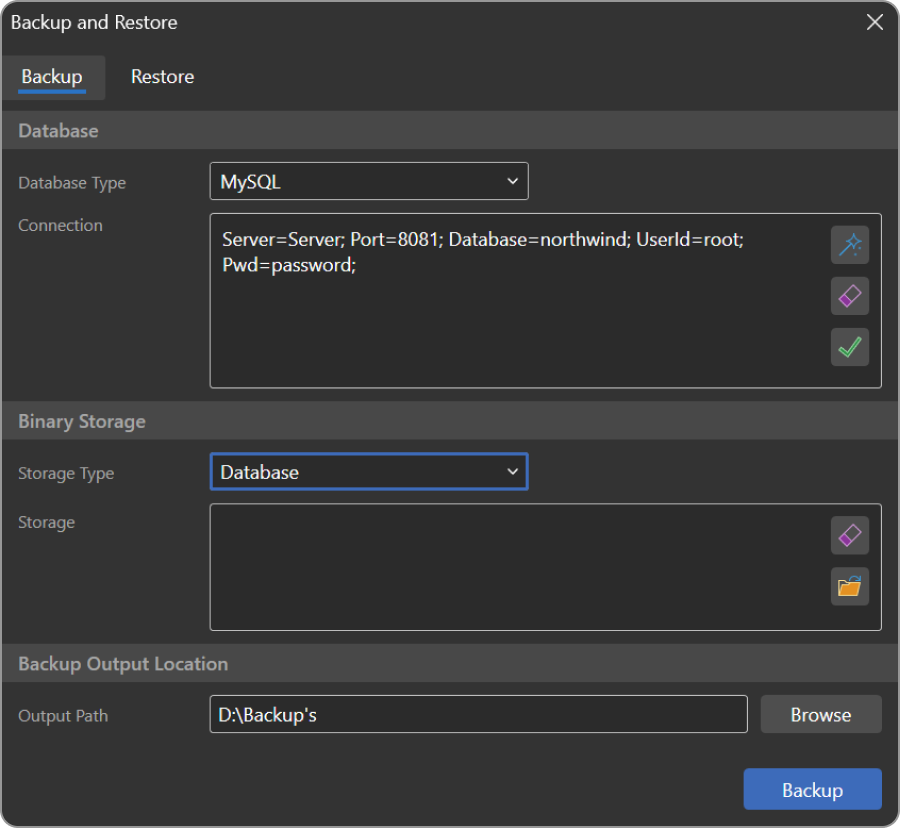
Want to see everything that's new? View all changes
Ready to explore version 2026.3?
The new version 2026.3 brings powerful updates to Reports and Dashboards. Build, visualize, and deliver your data with more flexibility and precision than ever before.Download a fully-functional 30-day trial and experience what’s new.