Time remains very little. From day to day we will release version 2015.1 of Stimulsoft Reports. And while our departments are putting the finishing touches, we will reveal to you the secrets of the StiMvcViewer component. In the release 2015.1, this component will support interactive reports. Now you can easily create reports with collapsing and interactive sorting.
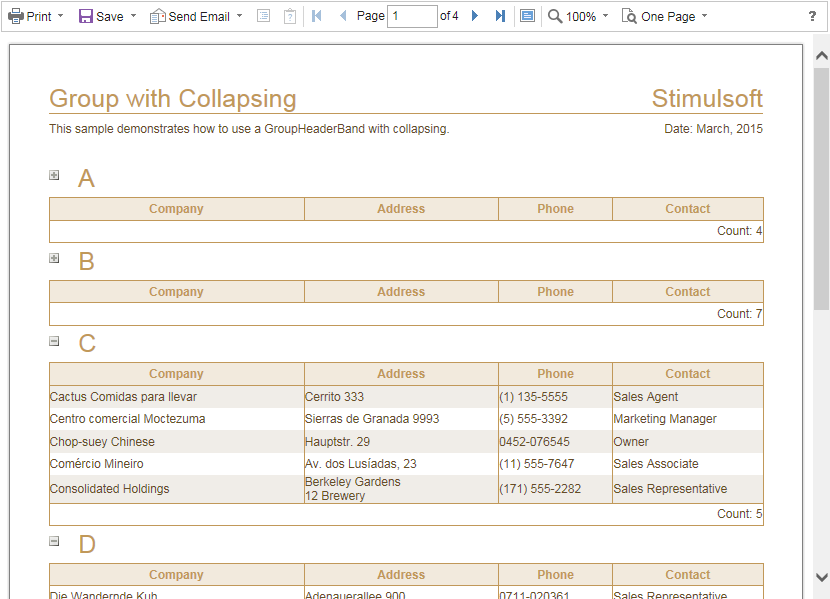
Collapsing is an opportunity to roll up and roll out, for example, groups directly in the rendered report. For example, if you have a report with groups, it usually displays the title of the group, and then the data by this group. In the case with collapsing the group title will be displayed and these groups can expand or collapse. Look closely at the picture below.
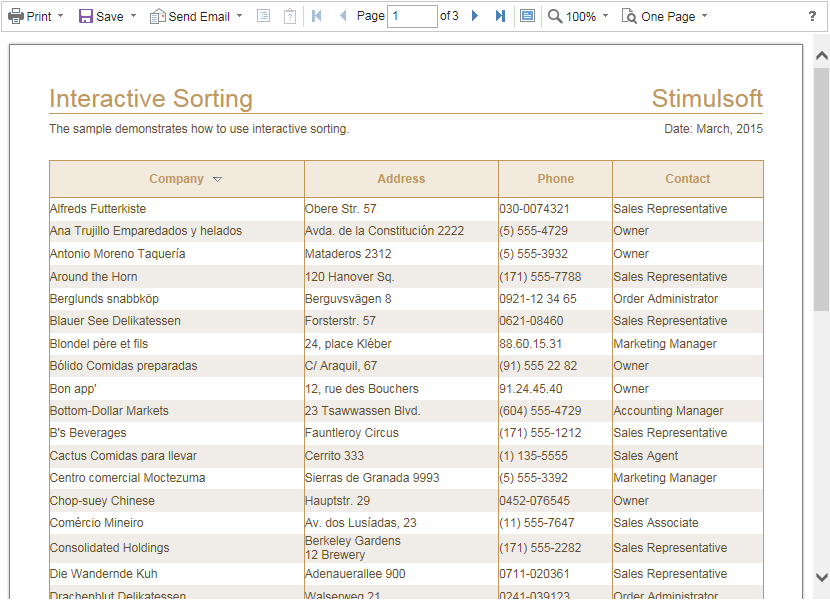
Interactive sorting means the ability to sort data in the rendered report. In other words, select the text component, assign a data column to it (by which sorting will be done) and render the report. When you click on this text component in the rendered report its content will be sorted. Each clicking on this component changes the sorting direction (ascending or descending order). It should be noted that the data column is used in the text component and the data column specified for the interactive sorting may vary. See an example below.
For full evolution we need two more steps. Therefore, in addition to all of the above, it is also possible to create drill down reports and reports with bookmarks.
Bookmarks can be found on a separate panel and used to quickly navigate through the report. For example, if a report is created with groups, the bookmarks are usually formed by the group name. This helps you to quickly jump to a specific group.
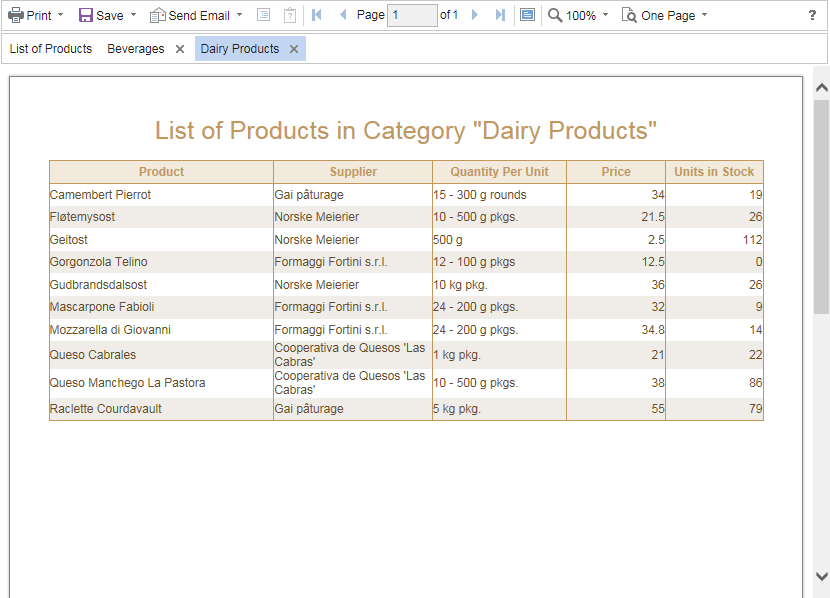
Drill down is a certain type of data connection. For example, there is a list of categories with descriptions and images. The drill-down reports have interactivity that is represented by showing the content when you click on any category (for example, a list of products). Below is an example of a drill down report.
By the way, creating interactive reports can be found in the documentation and our video tutorials. Leave your comments and questions here and we will answer you with pleasure.
Collapsing is an opportunity to roll up and roll out, for example, groups directly in the rendered report. For example, if you have a report with groups, it usually displays the title of the group, and then the data by this group. In the case with collapsing the group title will be displayed and these groups can expand or collapse. Look closely at the picture below.
Interactive sorting means the ability to sort data in the rendered report. In other words, select the text component, assign a data column to it (by which sorting will be done) and render the report. When you click on this text component in the rendered report its content will be sorted. Each clicking on this component changes the sorting direction (ascending or descending order). It should be noted that the data column is used in the text component and the data column specified for the interactive sorting may vary. See an example below.
For full evolution we need two more steps. Therefore, in addition to all of the above, it is also possible to create drill down reports and reports with bookmarks.
Bookmarks can be found on a separate panel and used to quickly navigate through the report. For example, if a report is created with groups, the bookmarks are usually formed by the group name. This helps you to quickly jump to a specific group.
Drill down is a certain type of data connection. For example, there is a list of categories with descriptions and images. The drill-down reports have interactivity that is represented by showing the content when you click on any category (for example, a list of products). Below is an example of a drill down report.
By the way, creating interactive reports can be found in the documentation and our video tutorials. Leave your comments and questions here and we will answer you with pleasure.