Conditional formatting of components is very often used when designing reports and dashboards. Conditional formatting implies changing the appearance settings of components, depending on the specified condition. This functionality allows you to efficiently perform visual data analysis, track data trends, exclude specific values in the report, and yon the dashboard.
Expressions in properties
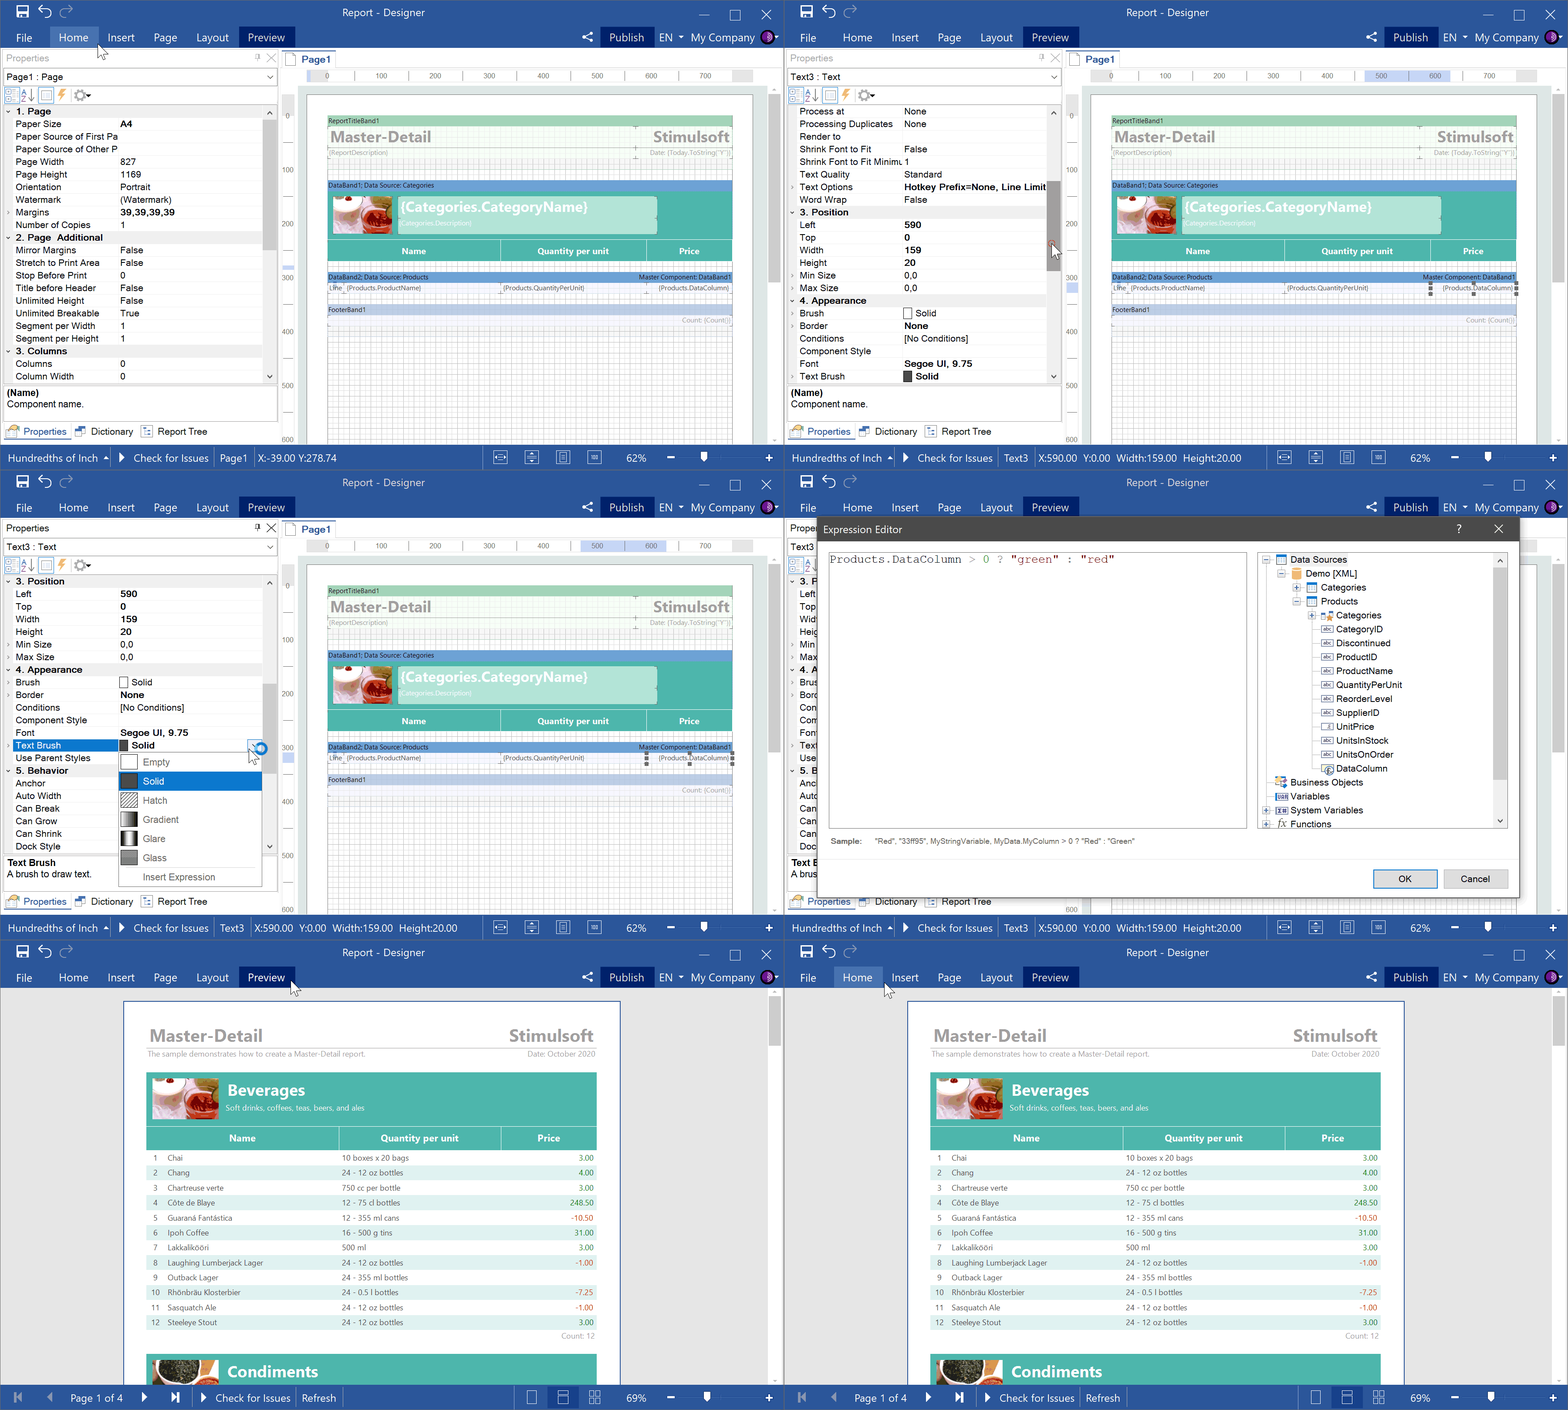
In the 2020.5.1 release, we simplified the ability to apply conditional formatting to report components. Now you can specify an expression in the values of some properties of a report component or dashboard item. As a result of calculating this expression, some appearance settings will be applied to the component.
In the new version, using expressions as property values, you can specify a condition:
- to apply a style to the report component, and for the Data bands, you can set the conditions for applying the styles for even/odd lines;
- to change the settings of the Brush and Text Brush properties for report components;
- to change the settings of the Fore Color and Back Color properties for dashboard elements;
- to change the settings for vertical and horizontal alignment properties for text components in reports;
- to apply the Dock Style to the component;
- to change the rotation angle of the content for the Image component.
Besides, we have added support for expressions in properties such as Enabled and Printable. Now you can specify a condition for enabling and disabling a report component or dashboard item. And also, set up the condition for printing report components.