Hello everybody! Unfortunately, summer is over, but a wonderful fall is coming. The season is time when we get started to work with new strengths and set the most ambitious goals for ourselves. To quickly and efficiently achieve goals in management, marketing, manufacturing and other spheres, you need high-quality and reliable software for data visualization and analytics. We are developing reporting tools and components to work with data and today we will tell you about creating reports, and specifically about how to do this work efficiently and quickly.
Creating a report with a large number of data is quite a long process. That`s why the Stimulsoft report designer contains special tools, which are used to make this work much easier. But first things first.
Ways of report creation
Firstly, let's figure out how we can create reports. There are three basic ways:- Manual design. This means adding, changing components, data connection, and manual design of elements.
- Using code. Everything is clear here - all report parameters are specified with a programming code.
- Report design using embedded tools. This is what we will tell you about in more detail.
Wizard
First, we will tell you about the main special tool – The Wizard. It is used, particularly, to develop simple and Master Detail-lists. To create a report with a simple list, you should follow the step-by-step instruction, which looks like this:- Connect data;
- Selection columns;
- Place data columns in the order you need;
- Sort, filter, and group data.
If needed, you may design your report - select a theme, apply a style, etc. To design a Master-Detail list, you should connect a data source with a relation, select several sources, and define relations.
In any case, after you create any report, you can edit it – for example add or remove some component, create and apply a style to it, add conditions, filters and much more.
Wizards of special reports
Also, the Stimulsoft report designer contains wizards to create definite custom reports, for example, invoices, business invoices, purchase orders, orders, and much more. In comparison with the Wizard, which was described before, these assistants are template customization.When choosing them, you can go in two ways:
- open a template in the designer;
- customize it, not only connect data but define the attributes of your company and select parameters of a report culture.
You should know that these assistants contain three examples of translation strings - German, English, and Russian. You can find more detailed information about translation strings in this article.
Besides, you can find wizards in our report designer, for example, with a label or a chart. They are hidden in the File menu, but you should type the request you need (chart or label) in the search line to display them.
You can find more detailed information about work with wizards on our YouTube channel following this link.
Online storage
Another variant that can be used to reduce the time spent on report creation is online storage. You should select a report in the storage, open it and reconnect your data.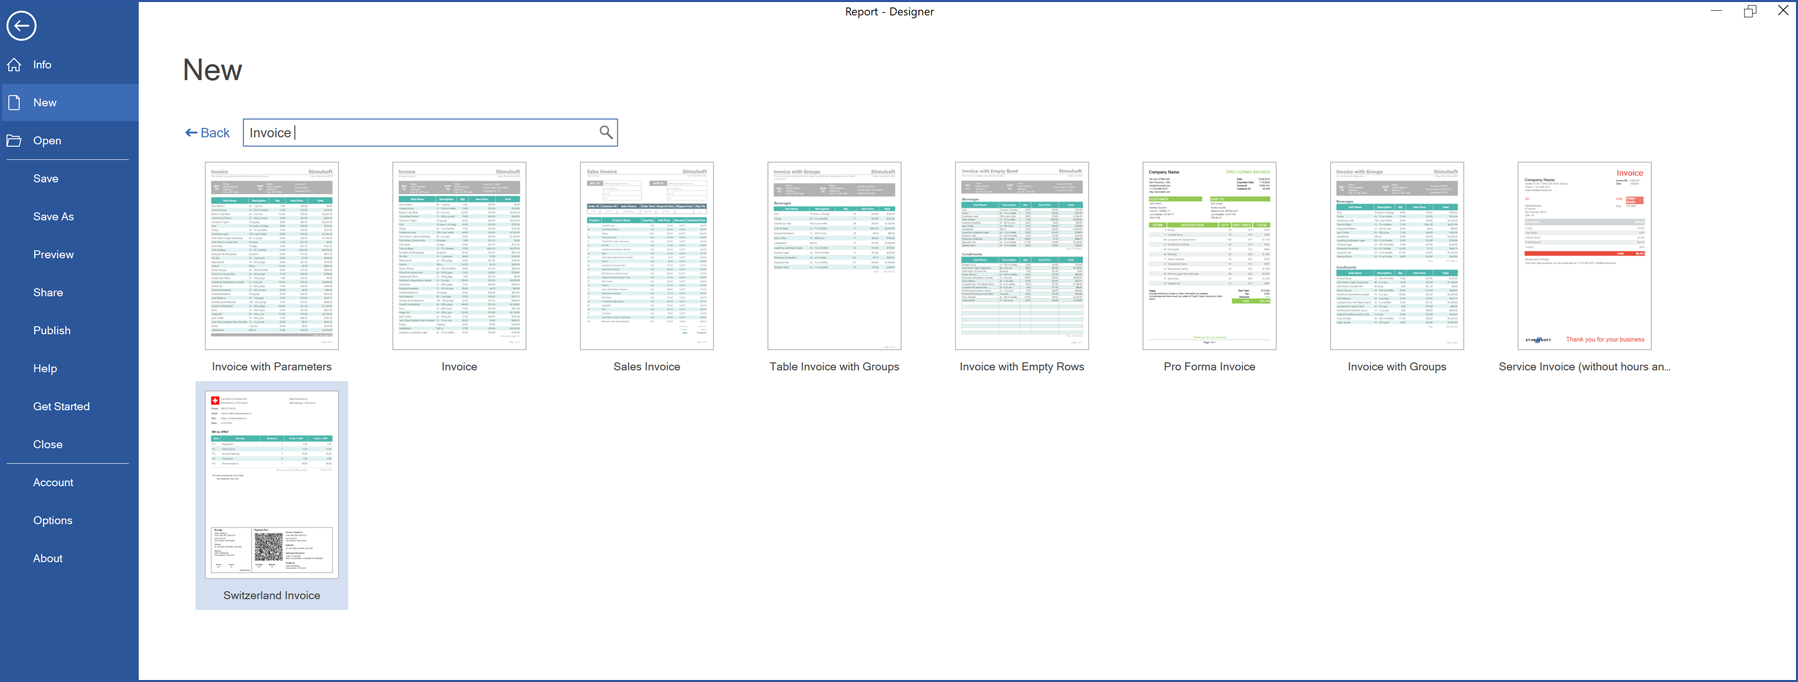
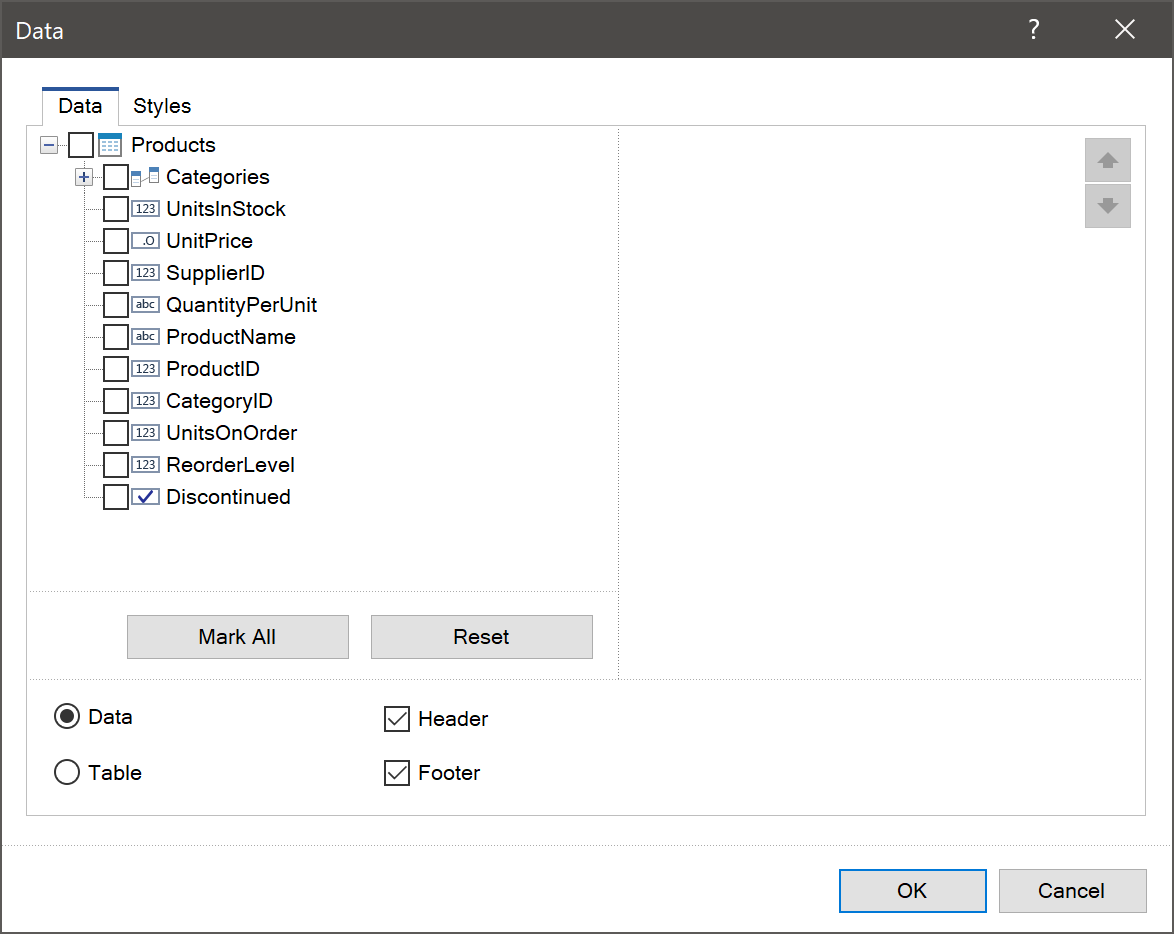
In conclusion, let's consider another exciting capability that allows you to create a list instantly. This capability is actual when you select the manual design mode. You should just drag a data source into the page, then define a component for data in a report in the opened window: the Table or the Data band. In addition, you can select data columns and report style, add the Header and the Footer bands.
We hope this article was helpful for you, and now you can use the assistants and create reports within the shortest time. If you have any questions, contact us – we will help you solve your problem.