All changes and innovations in the Stimulsoft reporting products are designed to make work with data more comfortable, fast, and effective. That's why we are constantly working on improving our products and regularly present new versions, which contain some new capabilities for data analysis and visualization. This time we will tell you about an enhancement of the functionality for dashboard panels – alignment of the table summary.
What is it?
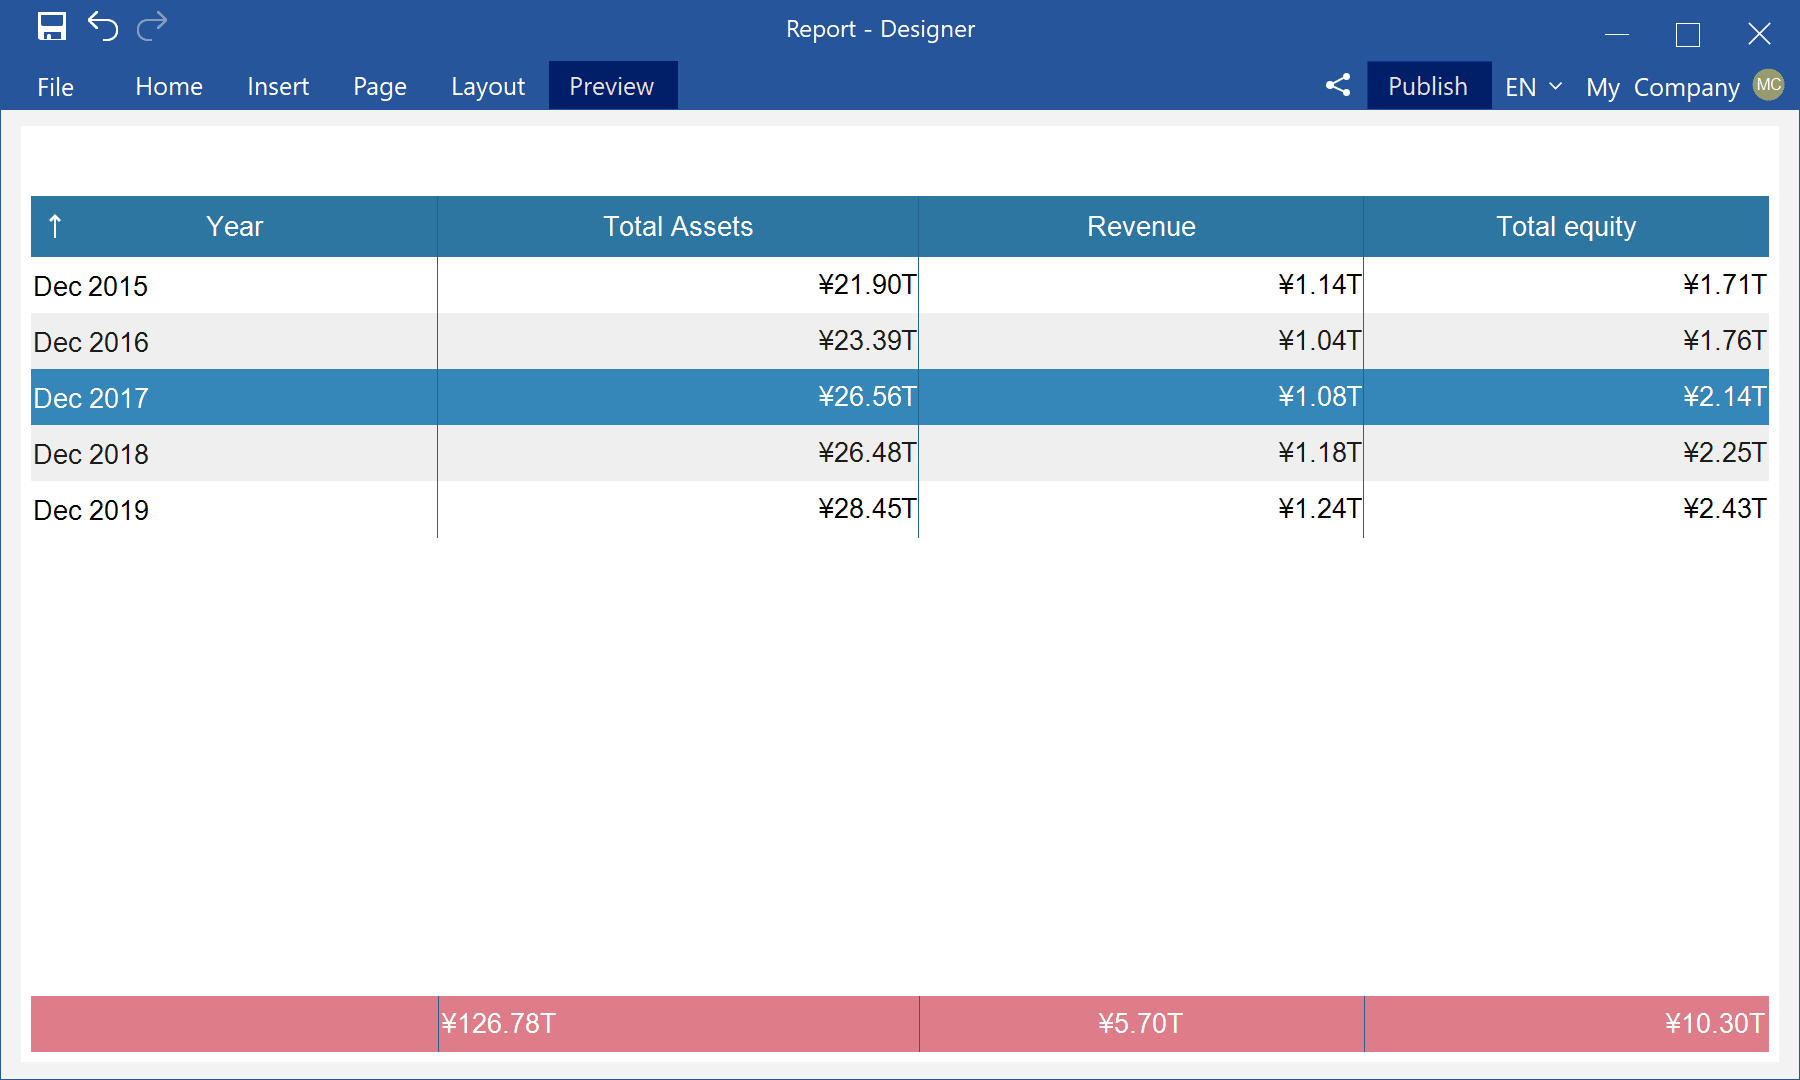
You may display the Summary on the Dashboard, for example, to sum all column values when working with the Table element on a dashboard. In previous versions of Stimulsoft products, the Summary was automatically right-aligned. In the 2021.3 version, it can be aligned left, right, center.How it works
The summary of the table column is aligned with the help of the Summary Alignment property. To do this, you should highlight the data column in the table editor and set the value you need on the property panel.
For a more visual demonstration of this functionality, we have prepared a short video with instructions for aligning the summary of table column:
We hope this article will help you understand how to work with the Table Summary Alignment, and you will be able to use this capability when creating dashboards in the future. If you have any questions, contact us – we will be glad to help you.