Welcome to all readers of Stimulsoft`s blog. In our articles we share the secrets of building reports and developing dashboards with the help of our reporting tools. Today we will talk about skill levels in the report designer again.
In the previous article we considered how a chosen skill level exerts influence over the display of Publish and Actions. These tools display only on Professional skill level, while when choosing Standard or Basic levels they don`t. Apart from these tools, skill level exerts influence over the display of report`s components in the designer. And in this article, we will talk about it in more detail.
All the components, which are intended for reports` development are divided into groups. When choosing Standard or Professional skill level the groups of components Bands, Cross, Components, Bar Code, Shapes, Chart, Gauge, Map display in the report designer in Insert or Toolbox.
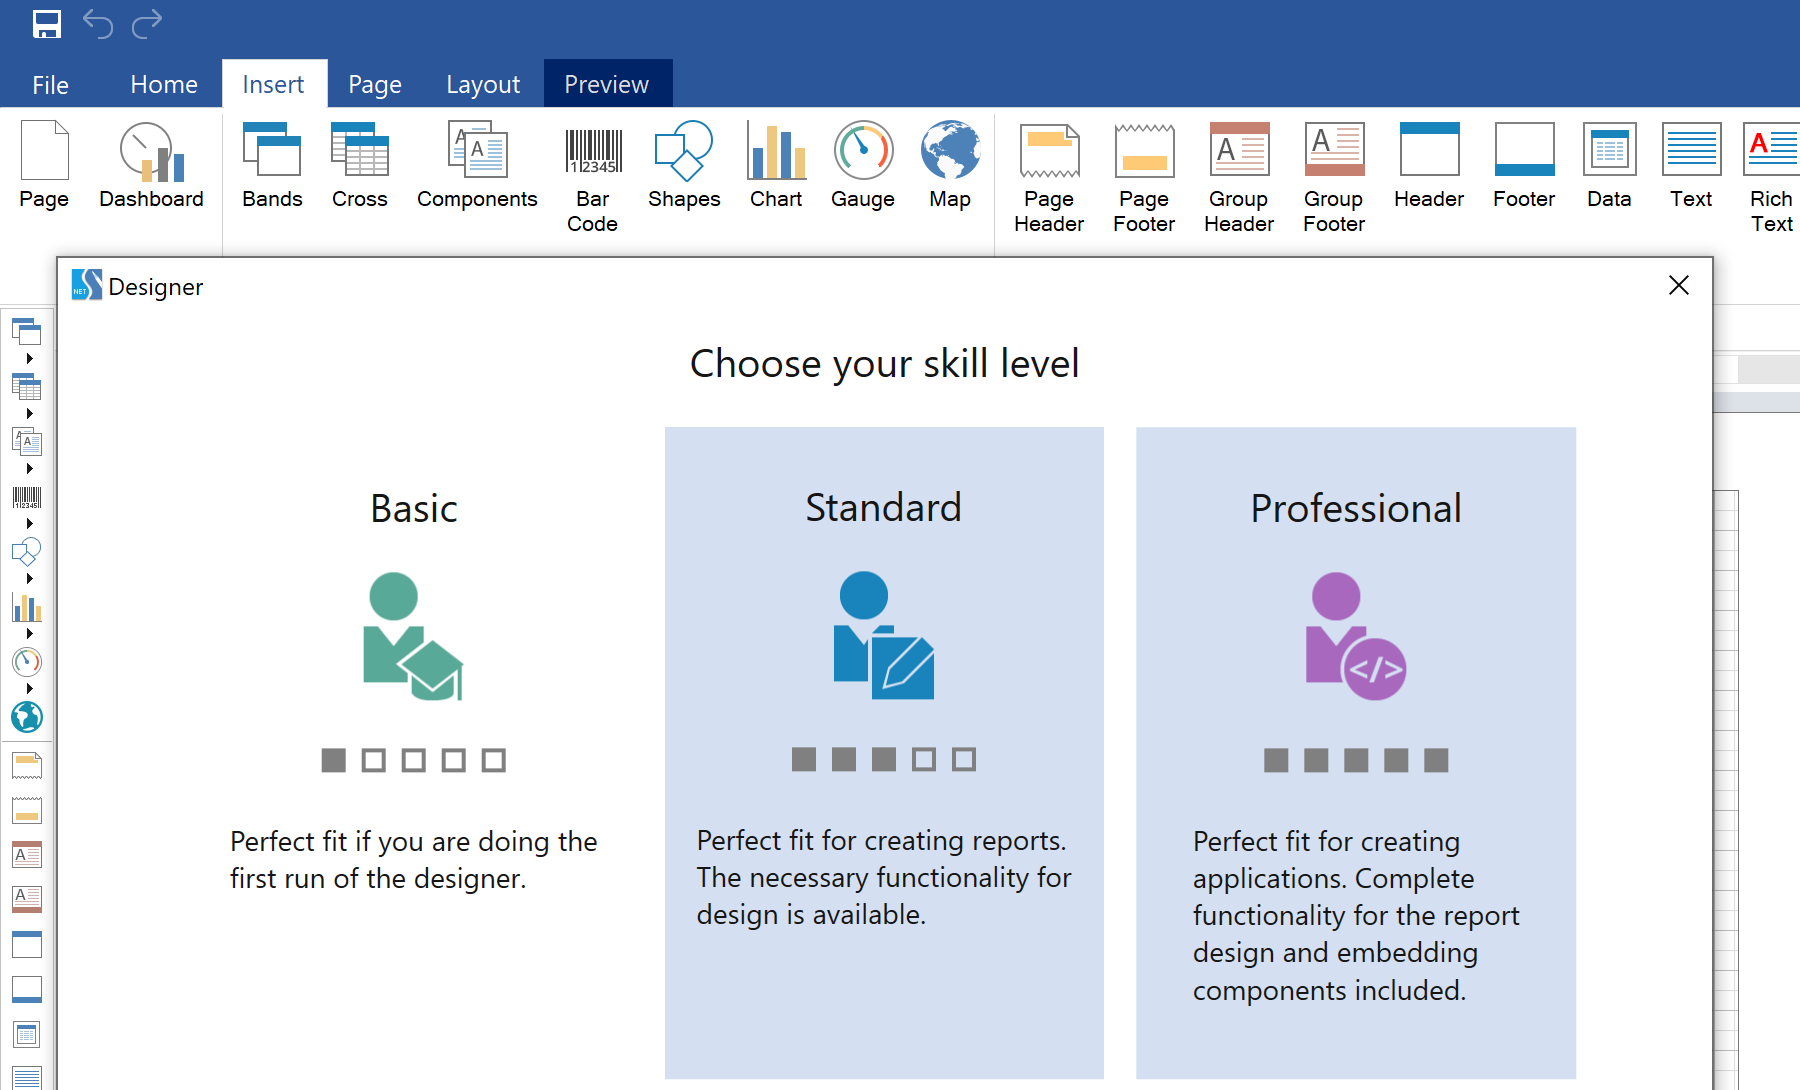
However, when choosing Basic skill level, the groups of components Gauge and Map don`t display.
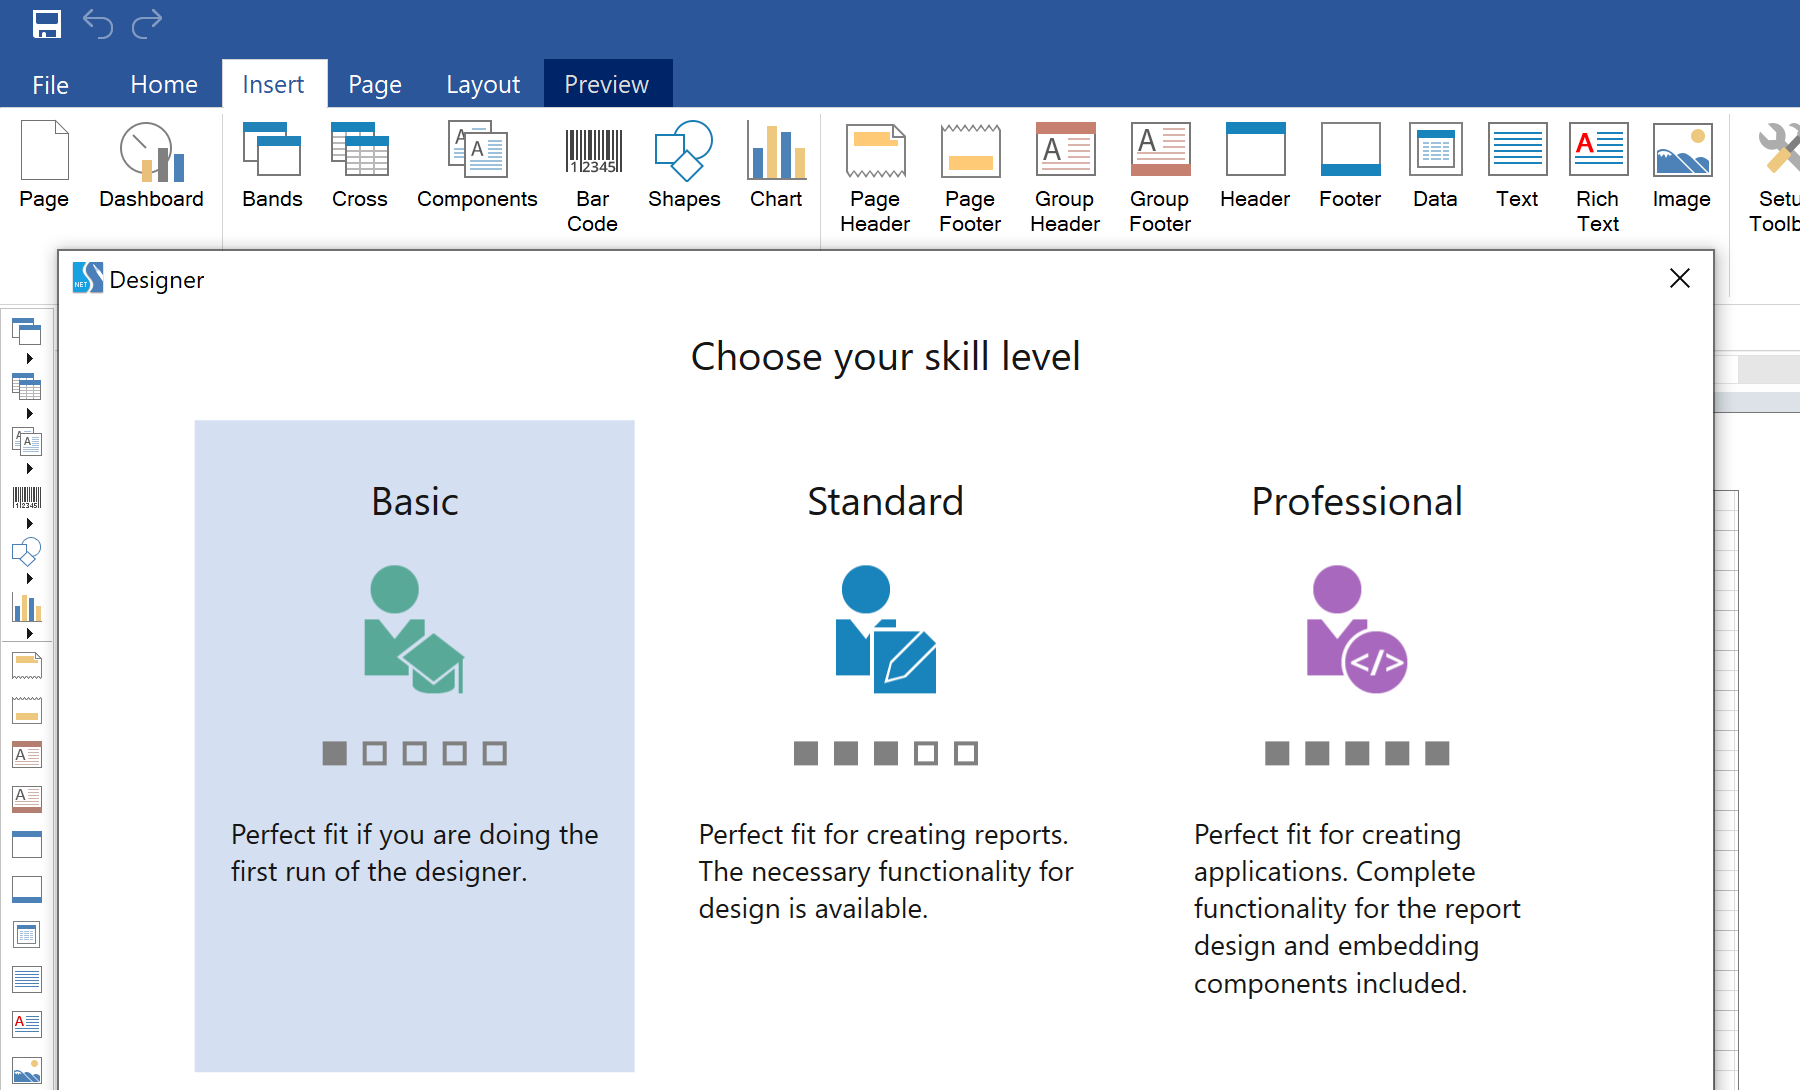
Also it`s worth considering that when choosing Basic skill level some components can be or not to be in the list of components of a definite group. Let`s consider it in more detail.
In Bands group they won`t display:
And in Components group they won`t display:
This way skill level exerts influence over both the display of components` groups and the display of components in these groups.
Besides, the display of properties of a definite report`s component or a dashboard depends on a chosen skill level. In our documentation we made comparison`s tables of skill levels and components` properties display. To get acquainted with this tables you can at the link.
This is where we complete the series of articles about skill levels and their influence on the display of various tools, groups, components and properties in the report designer. If you have any questions, please contact with us.
We wish you success in drawing up reporting and all the best!
The previous articles related:
In the previous article we considered how a chosen skill level exerts influence over the display of Publish and Actions. These tools display only on Professional skill level, while when choosing Standard or Basic levels they don`t. Apart from these tools, skill level exerts influence over the display of report`s components in the designer. And in this article, we will talk about it in more detail.
All the components, which are intended for reports` development are divided into groups. When choosing Standard or Professional skill level the groups of components Bands, Cross, Components, Bar Code, Shapes, Chart, Gauge, Map display in the report designer in Insert or Toolbox.
However, when choosing Basic skill level, the groups of components Gauge and Map don`t display.
Also it`s worth considering that when choosing Basic skill level some components can be or not to be in the list of components of a definite group. Let`s consider it in more detail.
In Bands group they won`t display:
- Column Header
- Column Footer
- Hierarchical Data
- Child
- Empty Data
- Overlay
And in Components group they won`t display:
- Clone
- Sub-Report
- Table
This way skill level exerts influence over both the display of components` groups and the display of components in these groups.
Besides, the display of properties of a definite report`s component or a dashboard depends on a chosen skill level. In our documentation we made comparison`s tables of skill levels and components` properties display. To get acquainted with this tables you can at the link.
This is where we complete the series of articles about skill levels and their influence on the display of various tools, groups, components and properties in the report designer. If you have any questions, please contact with us.
We wish you success in drawing up reporting and all the best!
The previous articles related: