We are pleased to announce the release of the new version Stimulsoft Reports 2016.1 which is now available for download. With this milestone we introduce new features which are the new barcode GS1-128, PostgreSQL data adapter in Reports.JS, Print with Preview for HTML5 viewer and designer, the cross-tab edit form in the HTML5 designer.
New Component in Reports.Web
In the release of 2016.1 the HTML5 Report Designer supports the Table component. The table consists of cells which are formed at the intersection of rows and columns. These cells can contain various data such as text, phrases, reference data column, RichText, image, checkboxes, etc.

When working with the Table component, you can set an unlimited number of rows that will be used to display headers and footers of data.
New Data Source in Reports.Web
In HTML5 and HTML5 for MVC we have added the ability to create a data source based on another source. Suppose, it is necessary to group the data, sort it, filter or perform calculations with these data, and then transfer the data to the report. In this case, the data source is created on the base of another source.

New Printing of Reports in Reports.JS
Starting with the version 2016.1 you can choose between printing commands in the HTML5 viewer and on the preview tab in the HTML5 designer. The following printing options are available:
- Print to PDF.
- Print with Preview.
- Print without preview.

Cross-tab in HTML5 Designer
Since the release of 2016.1 in the HTML5 report designer has the ability to edit and create reports with cross-tabs. Previously, it was possible only to preview cross-tabs and export reports with them. The Cross-tab is a special component that is designed to handle, group and summarize data from the source. This result is represented in the form of a table. The cross-tab editor includes three tabs, in which the data source is selected; the data columns are specified and the cross-tab style is defined.

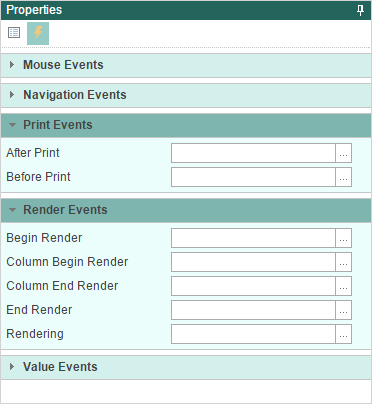
Events Tab in Reports.Web
On the property panel in the HTML5 designer, we added the Events tab, which contains a list of report events and events of the selected component. For example, if you want some action be carried out immediately after the rendering of the text component, you should subscribe to the End Render event of the text component.
Break if True
When using multi-level conditions, you can break the processing of conditions. By default, all the conditions are processed sequentially until the last level. In the release 2016.1 we added the Break if true option. If this option is enabled and the condition of any level is performed (returns the true value) then the break occurs and other conditions, located below, will not be processed. If the option is disabled, then all levels of conditions are processed sequentially. This option was added in Reports.Web, Reports.Net, Reports.Wpf, Reports.JS.

Infographics Menu
In the toolbar and in some designers in Insert tab you can find the new category – Infographics. This category includes all the graphics components like maps, gauges and all types of charts. You need just two clicks to add any required data visualization component to the report.

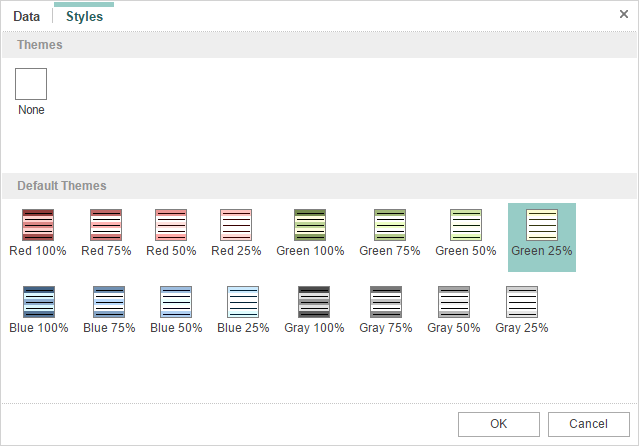
Updated Designer of Styles
The 2016.1 release comes with the completely new designer of styles. We have added new functionality and gave it new look. One of the main features of the updated editor of styles is that the created style is displayed on the thumbnail based on the settings of this style. Now you edit the styles and immediately see the result.

Updated Add Style Menu
In release 2016.1 we have redesigned the add style menu. The designer of styles can create a style for the report components, charts, gauges, cross-tabs, charts, and report controls. Each style will have its own settings considering the component to which it will be applied.

Updated Show Styles Menu
In the 2016.1 release we improved the Show Styles menu. With this menu, you can find the current style, see the available styles, and choose the appropriate one. Calling the drop-down list of the Show Styles menu can be done by clicking on the thumbnail.

AES-128 Encryption in PDF
In the version 2015.3 and earlier of our products, the RC4 40 and 128-bit, AES 256 bit encryption algorithms when you export a report to PDF using. Starting with the version 2016.1 of our products, the algorithm AES-128 encryption is also supported. This encryption algorithm is supported by Acrobat 7 and later. The option is added in Reports.Web products, Reports.Net, Reports.Wpf.
New Barcode GS1-128
In version 2016.1 we have added support for GS1-128 barcode. This barcode is designed to encode trade item data for logistics units, and may contain various information. For example, the product code, expiry dates, size, volume, batch code, etc. This barcode is added to the reporting tools Reports.Web, Reports.Net, Reports.Wpf.

New Preview in Reports.JS
In the new version we have implemented the full-featured report preview in the JS designer. Previously, the preview only as HTML was available. Now, the preview does not differ from the report viewer and has all its functionality. Available are printing options, exporting the report to PDF, HTML, HTML5, Microsoft Word and Excel. Also, the preview tab may have the search bar, bookmarks and parameters. It also contains navigation, zooming controls, and page view modes.

PostgreSQL in Reports.JS
Our product Stimulsoft Reports.JS worked with MS SQL, MySQL, Firebird data sources from the very first release. In the release of 2016.1 we added support for PostgreSQL adapter. Now you can create a PostgreSQL data source and design reports based on this source.

Variable of List Type in Reports.JS
When creating reports the variable is used in various cases. Typically, the variable stores a value used to retrieve data, including data filtering. In the release 2016.1 the variable can store a list of values. To do this, when you create a variable to determine its type and a list to choose.

Grid in HTML5 Designer
We have added the ability to display a grid on the page in HTML5 and JS designers. The grid is used for accurate alignment of the components relative to each other. For example, you can use the Snap to Grid command to bind the components of the report to the grid nodes. Drawing grid can be done with dots and lines. Enabling Grid and defining how it looks like can be done in the Options window.

Duplicate Page in HTML5 Designer
In the release 2016.1 designer now has the commend to copy a page. With this command you can create identical copies of the pages with all components and parameters. To select the copy command, you should call the context menu on the page header. This option was added in the products Reports.Web and Reports.JS.

Styles in Drag and Drop Wizard in HTML5 Designer
In this release, for HTML5 and JS designers, we added the ability to define the report style to create its structure. When you drag a data source on the report template the Data window is called in which you should select the data columns and define other options. Now, in this window, you will find the Styles tab. This tab provides predefined styles and custom collection of styles. Choose a style, and it will be immediately applied to create reports. This option was added in the products and Reports.Web Reports.JS.
URL to JSON Data Source in Reports.Java
Earlier you could only specify the path to the JSON file when creating the JSON data source in Reports.Java. Now, while creating the JSON data source, you can specify a URL as a path to the JSON file.

Edit Text in Parameters for Swing Viewer in Reports.Java
When using the parameters in the report, the name of the parameters and fields for entering values are placed on a separate panel. In this case, if you must enter the text into the parameter field, then, sometimes, there are some difficulties when typing, as only a part of the text is shown.
Since the release of 2016.1, we have added a text editor options for the Swing viewer.
By the links below you can see the full list of changes and download the latest version of the products
Stimulsoft Reports.Ultimate
Stimulsoft Reports.Net
Stimulsoft Reports.Silverlight
Stimulsoft Reports.Web
Stimulsoft Reports.Wpf
Stimulsoft Reports.WinRT
Stimulsoft Reports.JS
Stimulsoft Reports.Flex
Stimulsoft Reports.PHP
Stimulsoft Reports.Java
Stimulsoft Reports Server
New Component in Reports.Web
In the release of 2016.1 the HTML5 Report Designer supports the Table component. The table consists of cells which are formed at the intersection of rows and columns. These cells can contain various data such as text, phrases, reference data column, RichText, image, checkboxes, etc.
When working with the Table component, you can set an unlimited number of rows that will be used to display headers and footers of data.
New Data Source in Reports.Web
In HTML5 and HTML5 for MVC we have added the ability to create a data source based on another source. Suppose, it is necessary to group the data, sort it, filter or perform calculations with these data, and then transfer the data to the report. In this case, the data source is created on the base of another source.
New Printing of Reports in Reports.JS
Starting with the version 2016.1 you can choose between printing commands in the HTML5 viewer and on the preview tab in the HTML5 designer. The following printing options are available:
- Print to PDF.
- Print with Preview.
- Print without preview.
Cross-tab in HTML5 Designer
Since the release of 2016.1 in the HTML5 report designer has the ability to edit and create reports with cross-tabs. Previously, it was possible only to preview cross-tabs and export reports with them. The Cross-tab is a special component that is designed to handle, group and summarize data from the source. This result is represented in the form of a table. The cross-tab editor includes three tabs, in which the data source is selected; the data columns are specified and the cross-tab style is defined.
Events Tab in Reports.Web
On the property panel in the HTML5 designer, we added the Events tab, which contains a list of report events and events of the selected component. For example, if you want some action be carried out immediately after the rendering of the text component, you should subscribe to the End Render event of the text component.
Break if True
When using multi-level conditions, you can break the processing of conditions. By default, all the conditions are processed sequentially until the last level. In the release 2016.1 we added the Break if true option. If this option is enabled and the condition of any level is performed (returns the true value) then the break occurs and other conditions, located below, will not be processed. If the option is disabled, then all levels of conditions are processed sequentially. This option was added in Reports.Web, Reports.Net, Reports.Wpf, Reports.JS.
Infographics Menu
In the toolbar and in some designers in Insert tab you can find the new category – Infographics. This category includes all the graphics components like maps, gauges and all types of charts. You need just two clicks to add any required data visualization component to the report.
Updated Designer of Styles
The 2016.1 release comes with the completely new designer of styles. We have added new functionality and gave it new look. One of the main features of the updated editor of styles is that the created style is displayed on the thumbnail based on the settings of this style. Now you edit the styles and immediately see the result.
Updated Add Style Menu
In release 2016.1 we have redesigned the add style menu. The designer of styles can create a style for the report components, charts, gauges, cross-tabs, charts, and report controls. Each style will have its own settings considering the component to which it will be applied.
Updated Show Styles Menu
In the 2016.1 release we improved the Show Styles menu. With this menu, you can find the current style, see the available styles, and choose the appropriate one. Calling the drop-down list of the Show Styles menu can be done by clicking on the thumbnail.
AES-128 Encryption in PDF
In the version 2015.3 and earlier of our products, the RC4 40 and 128-bit, AES 256 bit encryption algorithms when you export a report to PDF using. Starting with the version 2016.1 of our products, the algorithm AES-128 encryption is also supported. This encryption algorithm is supported by Acrobat 7 and later. The option is added in Reports.Web products, Reports.Net, Reports.Wpf.
New Barcode GS1-128
In version 2016.1 we have added support for GS1-128 barcode. This barcode is designed to encode trade item data for logistics units, and may contain various information. For example, the product code, expiry dates, size, volume, batch code, etc. This barcode is added to the reporting tools Reports.Web, Reports.Net, Reports.Wpf.
New Preview in Reports.JS
In the new version we have implemented the full-featured report preview in the JS designer. Previously, the preview only as HTML was available. Now, the preview does not differ from the report viewer and has all its functionality. Available are printing options, exporting the report to PDF, HTML, HTML5, Microsoft Word and Excel. Also, the preview tab may have the search bar, bookmarks and parameters. It also contains navigation, zooming controls, and page view modes.
PostgreSQL in Reports.JS
Our product Stimulsoft Reports.JS worked with MS SQL, MySQL, Firebird data sources from the very first release. In the release of 2016.1 we added support for PostgreSQL adapter. Now you can create a PostgreSQL data source and design reports based on this source.
Variable of List Type in Reports.JS
When creating reports the variable is used in various cases. Typically, the variable stores a value used to retrieve data, including data filtering. In the release 2016.1 the variable can store a list of values. To do this, when you create a variable to determine its type and a list to choose.
Grid in HTML5 Designer
We have added the ability to display a grid on the page in HTML5 and JS designers. The grid is used for accurate alignment of the components relative to each other. For example, you can use the Snap to Grid command to bind the components of the report to the grid nodes. Drawing grid can be done with dots and lines. Enabling Grid and defining how it looks like can be done in the Options window.
Duplicate Page in HTML5 Designer
In the release 2016.1 designer now has the commend to copy a page. With this command you can create identical copies of the pages with all components and parameters. To select the copy command, you should call the context menu on the page header. This option was added in the products Reports.Web and Reports.JS.
Styles in Drag and Drop Wizard in HTML5 Designer
In this release, for HTML5 and JS designers, we added the ability to define the report style to create its structure. When you drag a data source on the report template the Data window is called in which you should select the data columns and define other options. Now, in this window, you will find the Styles tab. This tab provides predefined styles and custom collection of styles. Choose a style, and it will be immediately applied to create reports. This option was added in the products and Reports.Web Reports.JS.
URL to JSON Data Source in Reports.Java
Earlier you could only specify the path to the JSON file when creating the JSON data source in Reports.Java. Now, while creating the JSON data source, you can specify a URL as a path to the JSON file.
Edit Text in Parameters for Swing Viewer in Reports.Java
When using the parameters in the report, the name of the parameters and fields for entering values are placed on a separate panel. In this case, if you must enter the text into the parameter field, then, sometimes, there are some difficulties when typing, as only a part of the text is shown.
Since the release of 2016.1, we have added a text editor options for the Swing viewer.
By the links below you can see the full list of changes and download the latest version of the products
Stimulsoft Reports.Ultimate
Stimulsoft Reports.Net
Stimulsoft Reports.Silverlight
Stimulsoft Reports.Web
Stimulsoft Reports.Wpf
Stimulsoft Reports.WinRT
Stimulsoft Reports.JS
Stimulsoft Reports.Flex
Stimulsoft Reports.PHP
Stimulsoft Reports.Java
Stimulsoft Reports Server