Dear friends, clients, the pandemic of coronavirus swept the whole world. Perhaps, there is no such country, which didn`t face this trouble. However, our life and work go on, and we don`t stand aside, our products are actively used for monitoring the situation with COVID-19.
In March when the world went into quarantine, our clients started creating dashboards which demonstrate the tendencies of pandemic of COVID-19 in the world, the number of infected, dead and recovered people. The examples of our users` dashboards represent analytical data, which include following elements: indicators, tables, maps, charts.
In March when the world went into quarantine, our clients started creating dashboards which demonstrate the tendencies of pandemic of COVID-19 in the world, the number of infected, dead and recovered people. The examples of our users` dashboards represent analytical data, which include following elements: indicators, tables, maps, charts.
Indicators
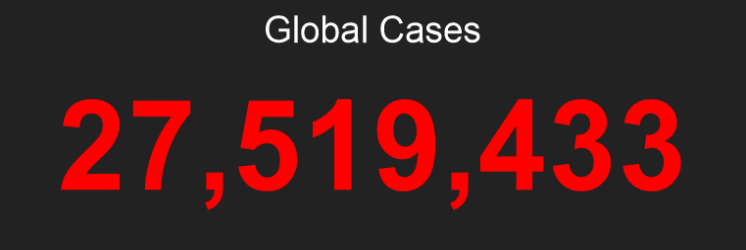
Indicators represent aggregated data on identified cases of infection, death and recovery from coronavirus. For example, in more successful from our point of view, dashboard, following metrics with the using of indicators are presented:Global Cases
Global Deaths

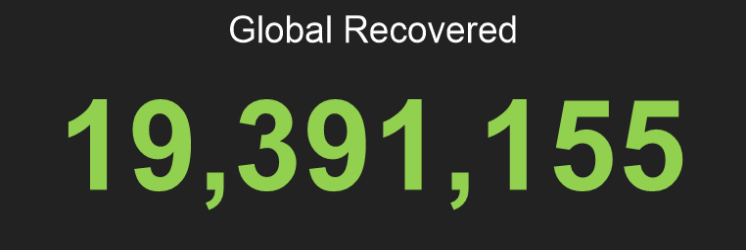
Global Recovered
Tables
In the tables the statistics of deaths and recoveries by countries are presented. Changing the sorting of data, thus we can monitor the countries with the greatest number of deaths` cases or recovery.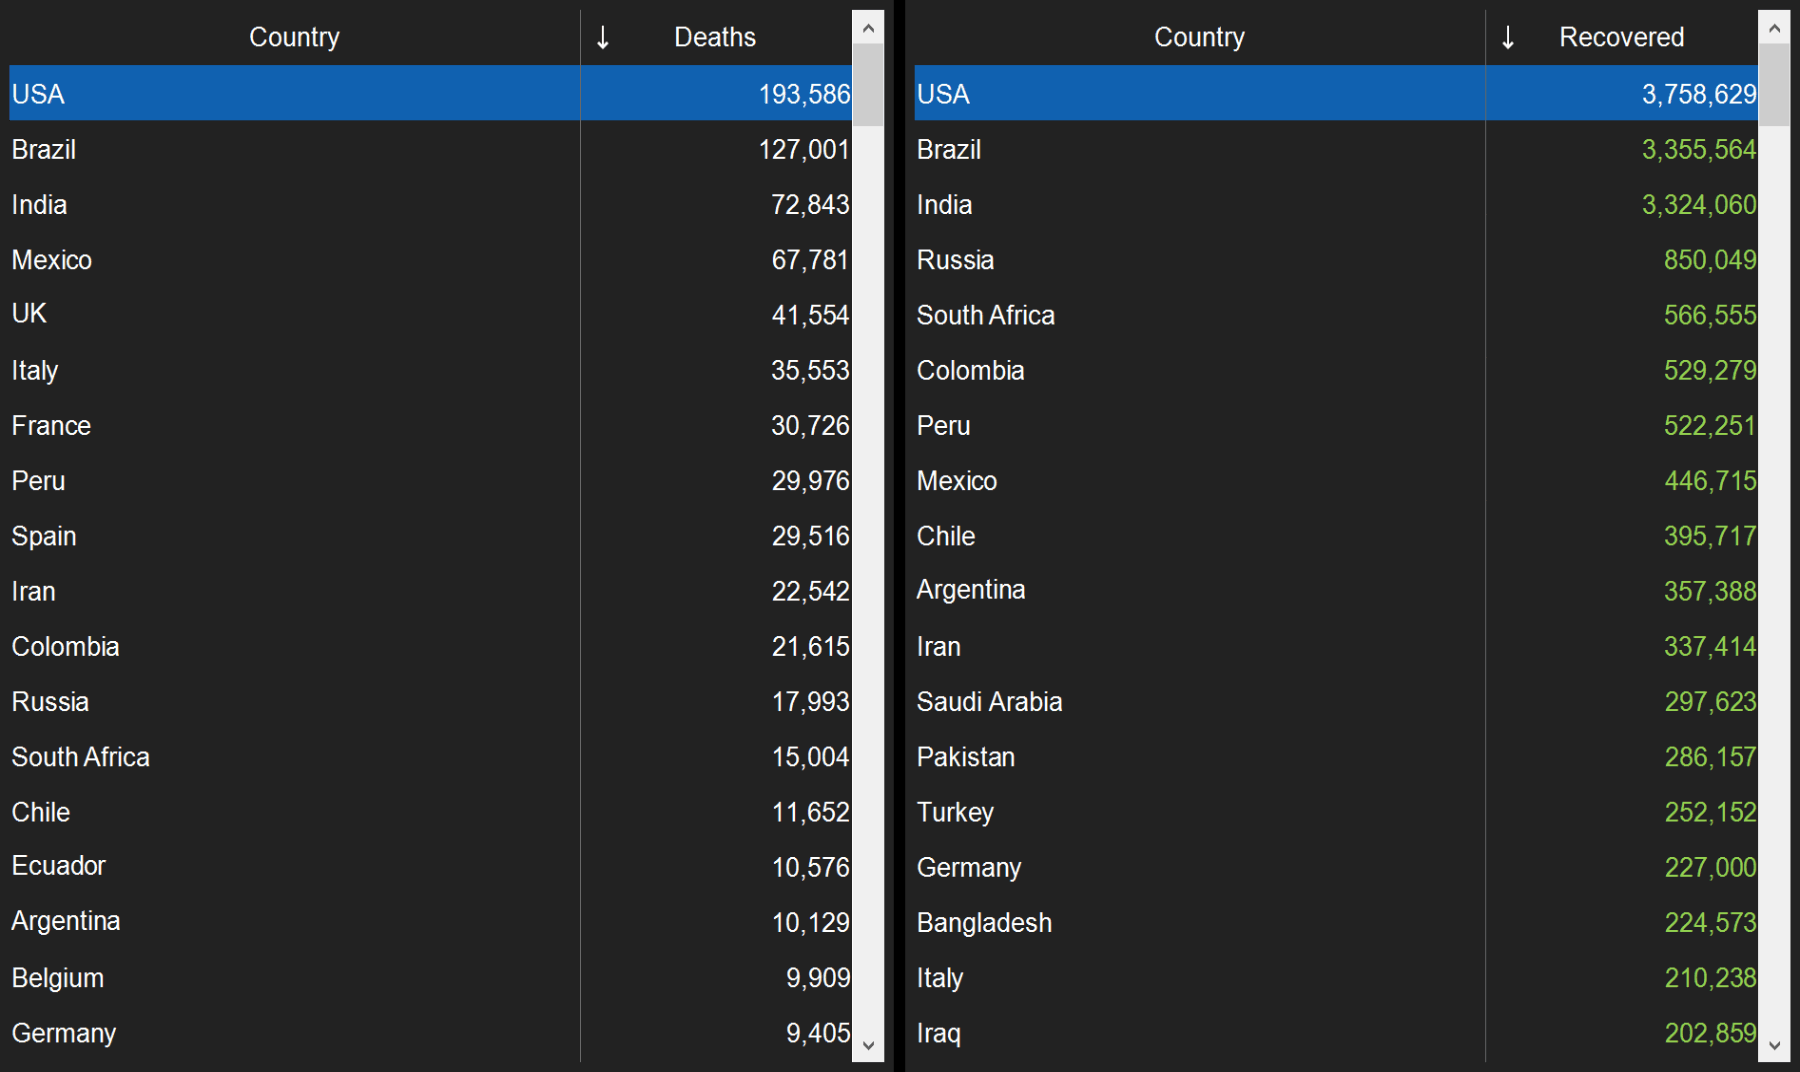
Charts
Charts give an opportunity to visualize data for each date during the pandemic. Data`s array from the beginning of the pandemic gives an opportunity to guess the tendencies of development of situation with COVID-19.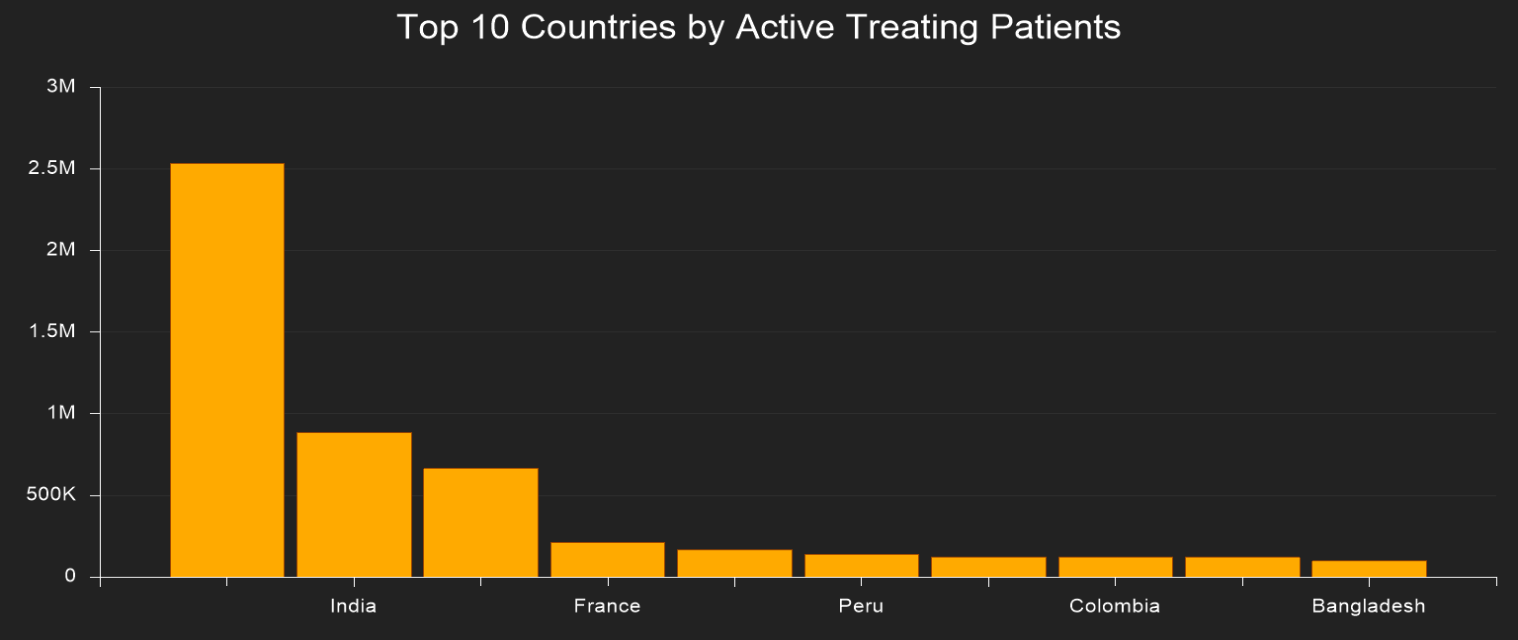
Online Map
With the help of the Online Map you can display the number of infections for each geographic object on the dashboard. The bubbles of the map give an opportunity visually compare the number of identified cases in a definite country. This way with the help of the map you can watch the most infected territories and the places with most spreading of COVID-19 in the world.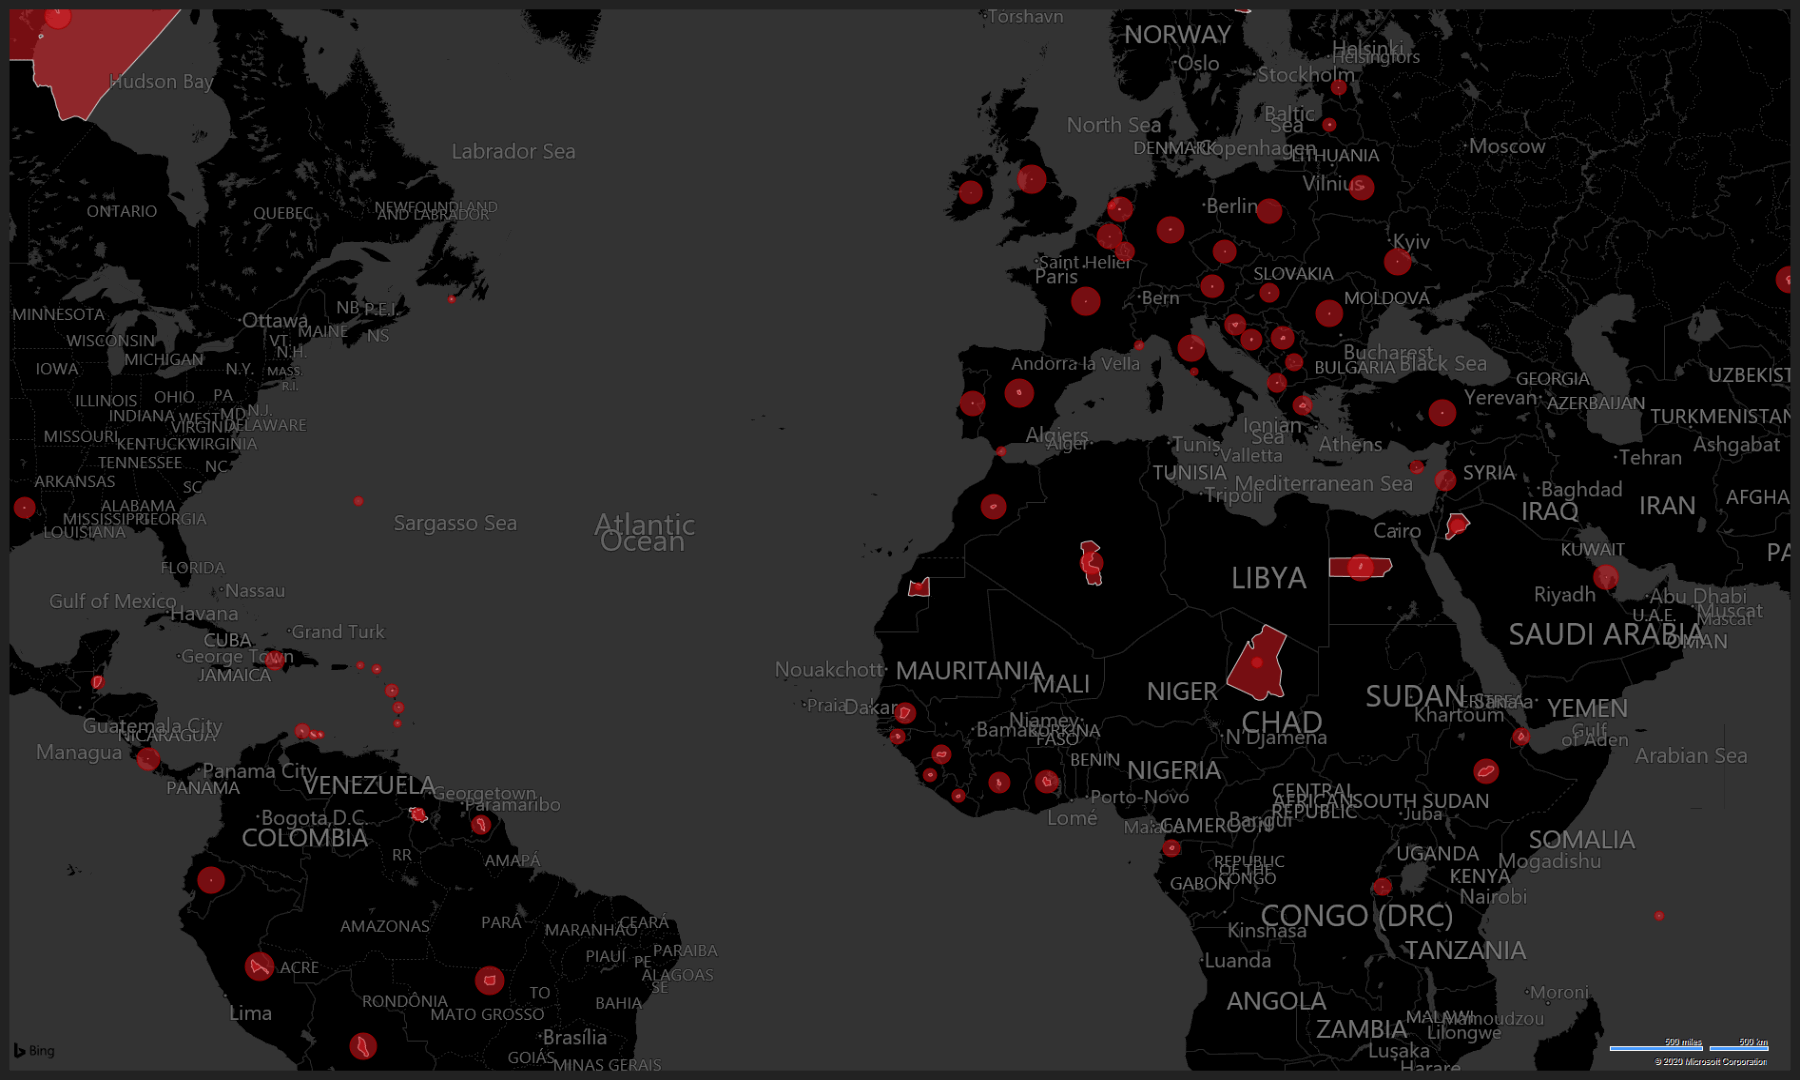
As a result, you can use products of Stimulsoft for analysis and visualization of data in the situation with coronavirus in all over the world. And, we in turn, wish our clients never face this pandemic and good health, of course.