Hello everybody! We return to the series of articles about the components of the Stimulsoft report designer. The last story was about the Panel element and its functionality, and today let’s talk about the Shapes element.
In particular, placing shapes on the dashboard helps visually symbolize an analytical panel. For example, using the Shapes element, we displayed a medical cross on a dashboard that shows hospital statistics.
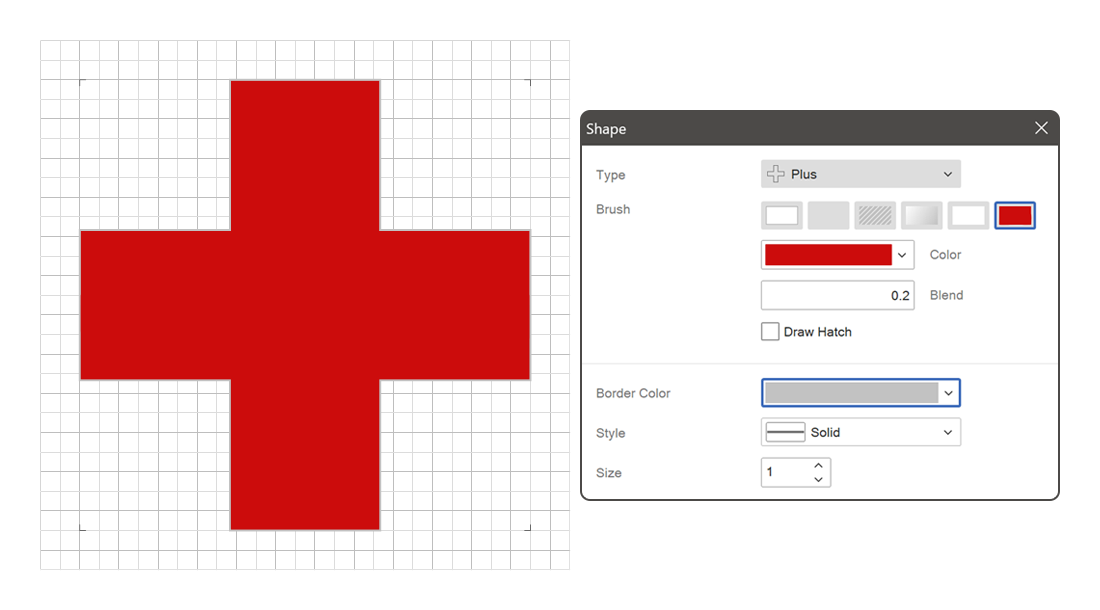
The Shapes element contains a number of design settings.
You can learn how to create a dashboard with the Shapes element in our documentation.
Shapes
This element allows you to add various primitives to the dashboard:- equation shapes;
- block arrows;
- lines;
- flowchart.
In particular, placing shapes on the dashboard helps visually symbolize an analytical panel. For example, using the Shapes element, we displayed a medical cross on a dashboard that shows hospital statistics.
The Shapes element contains a number of design settings.
Icons properties in the Shapes element
You may customize Icons in the element editor in different ways: choose the fill type, the icon color and its borders, specify the size of the borders, angle, blend, and icon scale.You can learn how to create a dashboard with the Shapes element in our documentation.
If you have any questions regarding this article or the creation of a dashboard with the Shapes element, feel free to contact us. We are happy to help you.