We continue our series of articles about the new capabilities of Stimulsoft reporting tools that appeared in the version of our products 2021.3. In this article, you will know about one important innovation. This functionality allows you to specify several views for the Chart element on a dashboard.
This functionality solves at least two issues:
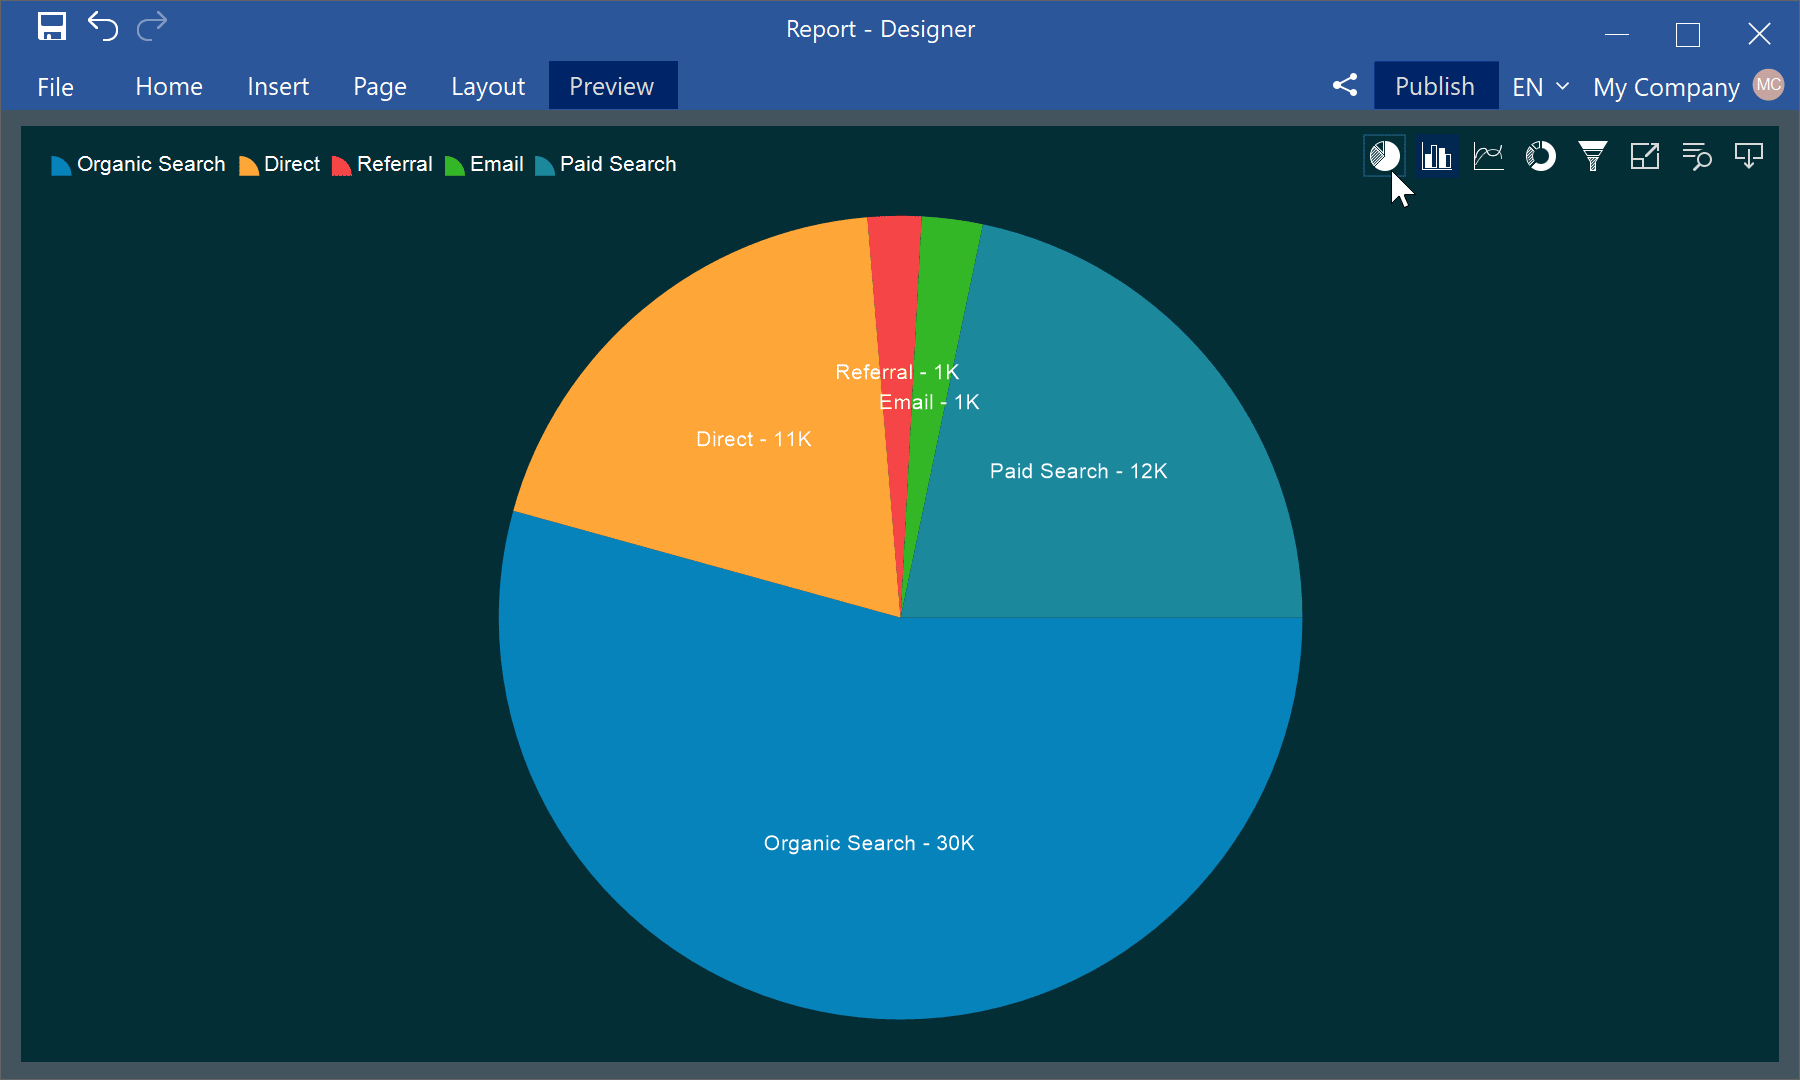
The main advantage of this new feature is the ability to switch views in the viewer with the help of controls, which, for example, allows you to increase the space on a dashboard to accommodate more components.
We hope this article will help you understand the new capabilities of dashboard creation. In addition to this, you will be able to visualize and analyze data more efficiently. If you have any questions, contact us – we will be glad to help you.
A little problem and a great solution
Our users used to face the problem of the lack of place for data on a dashboard. Due to this, they had to reduce the size of charts and other components. One of the solutions to this problem was to combine several charts into one.This functionality solves at least two issues:
- make the use of charts more comfortable;
- visualize data on a dashboard in different views.
The main advantage of this new feature is the ability to switch views in the viewer with the help of controls, which, for example, allows you to increase the space on a dashboard to accommodate more components.
We hope this article will help you understand the new capabilities of dashboard creation. In addition to this, you will be able to visualize and analyze data more efficiently. If you have any questions, contact us – we will be glad to help you.