Printing the Table from Code
Unsere Beispiele der Projekte und Berichtsvorlagen helfen Ihnen, die Grundlagen der Arbeit mit unserer Software zu erlernen.This example shows how to create and print data table from JavaScript code. As input, define a text area with JSON data and allow to change this data:
On the button click event
Next, add a Header Band and Data Band to the report:
Next, place Text Boxes with titles of data on the Header Band, and Text Boxes with reference to data source fields on the Data Band:
Then, add the Footer Band with the Text Box to the report for showing the Total value:
In the end, assign the report and show it in the viewer:
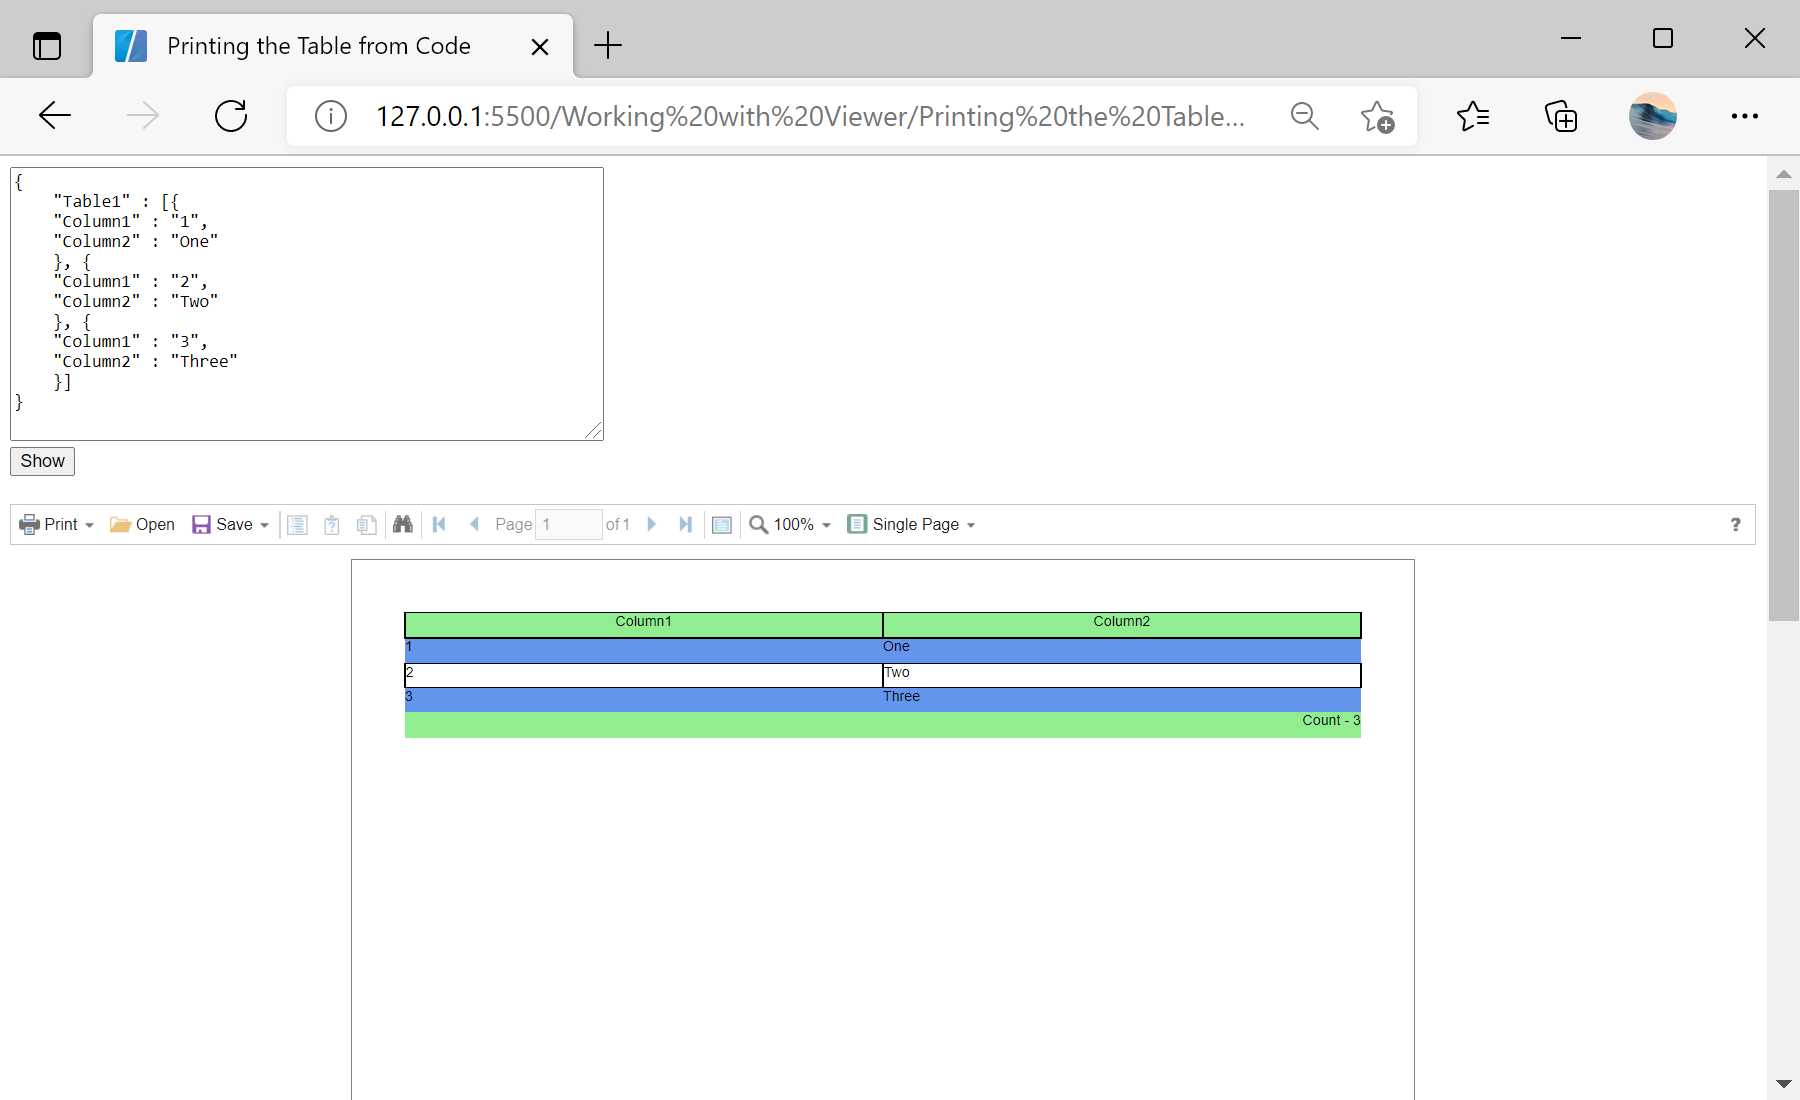
Auf dem Screenshot unten Sie können das Ergebnis des Beispiel-Codes ansehen:
<textarea name="jsonString" id="jsonString" style="width: 440px; height: 200px;">
{
	"Table1" : [{
		"Column1" : "1",
		"Column2" : "One"
	}, {
		"Column1" : "2",
		"Column2" : "Two"
	}, {
		"Column1" : "3",
		"Column2" : "Three"
	}]
}
</textarea><br />
<input type="submit" value="Show" onclick="onShowClick()" />
On the button click event
onShowClick() create a report and all of its components with code. First, create a new report and prepare data for it:
function onShowClick() {
	var jsonData = JSON.parse(jsonString.value);

	var dataSet = new Stimulsoft.System.Data.DataSet();
	dataSet.readJson(jsonData);
	var data = dataSet.tables.getByIndex(0);

	var report = new Stimulsoft.Report.StiReport();

	// Add data to datastore
	report.regData("data", "data", dataSet);

	// Fill dictionary
	var dataSource = new Stimulsoft.Report.Dictionary.StiDataTableSource(data.tableName, data.tableName, data.tableName);
	dataSource.columns.add(new Stimulsoft.Report.Dictionary.StiDataColumn("Column1", "Column1", "Column1"));
	dataSource.columns.add(new Stimulsoft.Report.Dictionary.StiDataColumn("Column2", "Column2", "Column2"));
	report.dictionary.dataSources.add(dataSource);

...
Next, add a Header Band and Data Band to the report:
...

	var page = report.pages.getByIndex(0);

	// Create HeaderBand
	var headerBand = new Stimulsoft.Report.Components.StiHeaderBand();
	headerBand.height = 0.5;
	headerBand.name = "HeaderBand";
	page.components.add(headerBand);

	// Create Databand
	var dataBand = new Stimulsoft.Report.Components.StiDataBand();
	dataBand.dataSourceName = data.tableName;
	dataBand.height = 0.5;
	dataBand.name = "DataBand";
	page.components.add(dataBand);

...
Next, place Text Boxes with titles of data on the Header Band, and Text Boxes with reference to data source fields on the Data Band:
...

	// Create texts
	var pos = 0;
	var columnWidth = Stimulsoft.Base.StiAlignValue.alignToMinGrid(page.width / data.columns.count, 0.1, true);
	var nameIndex = 1;

	for (var index in data.columns.list) {
		var dataColumn = data.columns.list[index];
		// Create text on header
		var headerText = new Stimulsoft.Report.Components.StiText();
		headerText.clientRectangle = new Stimulsoft.Base.Drawing.RectangleD(pos, 0, columnWidth, 0.5);
		headerText.text = dataColumn.caption;
		headerText.horAlignment = Stimulsoft.Base.Drawing.StiTextHorAlignment.Center;
		headerText.name = "HeaderText" + nameIndex.toString();
		headerText.brush = new Stimulsoft.Base.Drawing.StiSolidBrush(Stimulsoft.System.Drawing.Color.lightGreen);
		headerText.border.side = Stimulsoft.Base.Drawing.StiBorderSides.All;
		headerBand.components.add(headerText);

		// Create text on Data Band
		var dataText = new Stimulsoft.Report.Components.StiText();
		dataText.clientRectangle = new Stimulsoft.Base.Drawing.RectangleD(pos, 0, columnWidth, 0.5);
		dataText.text = String.format("{{0}.{1}}", data.tableName, dataColumn.columnName);
		dataText.name = "DataText" + nameIndex.toString();
		dataText.border.side = Stimulsoft.Base.Drawing.StiBorderSides.All;

		// Add highlight
		var condition = new Stimulsoft.Report.Components.StiCondition();
		condition.backColor = Stimulsoft.System.Drawing.Color.cornflowerBlue;
		condition.textColor = Stimulsoft.System.Drawing.Color.black;
		condition.expression = "(Line & 1) == 1";
		condition.item = Stimulsoft.Report.Components.StiFilterItem.Expression;
		dataText.conditions.add(condition);

		dataBand.components.add(dataText);

		pos = pos + columnWidth;
		nameIndex++;
	}

...
Then, add the Footer Band with the Text Box to the report for showing the Total value:
...

	// Create FooterBand
	var footerBand = new Stimulsoft.Report.Components.StiFooterBand();
	footerBand.height = 0.5;
	footerBand.name = "FooterBand";
	page.components.add(footerBand);

	// Create text on footer
	var footerText = new Stimulsoft.Report.Components.StiText();
	footerText.clientRectangle = new Stimulsoft.Base.Drawing.RectangleD(0, 0, page.width, 0.5);
	footerText.text = "Count - {Count()}";
	footerText.horAlignment = Stimulsoft.Base.Drawing.StiTextHorAlignment.Right;
	footerText.name = "FooterText";
	footerText.brush = new Stimulsoft.Base.Drawing.StiSolidBrush(Stimulsoft.System.Drawing.Color.lightGreen);
	footerBand.components.add(footerText);

...
In the end, assign the report and show it in the viewer:
...

	viewer.report = report;
};
Auf dem Screenshot unten Sie können das Ergebnis des Beispiel-Codes ansehen: