The fifth and the final article from the series "Conditions - Understandable for Everyone" will unveil all the questions you may have about the Icon Set Condition. In previous articles we reviewed Conditions in general and their types Highlight Condition, Data Bar and Color Scale Condition.
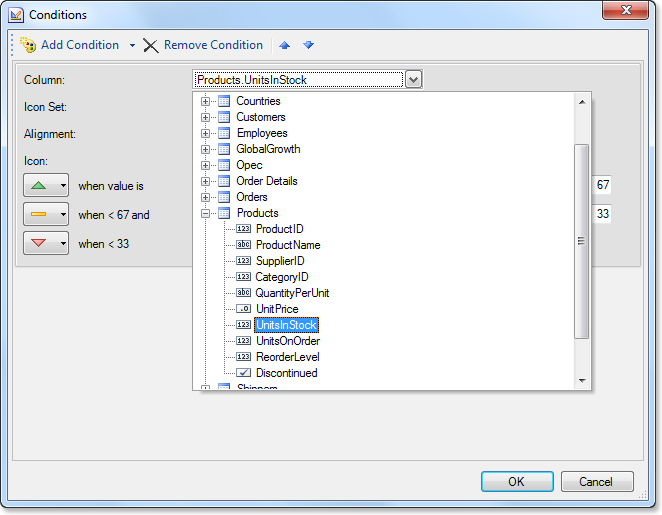
The Icon Set Condition is one of the easiest Conditions type. It may seem that the Icon Set simply marks components in the report, but it is not correct. Besides the basic functions of "visual selection", this Condition sorts components by specified condition, assigning an icon to each data category. And the variety of icons is vast. Sorting itself can be performed from two to five values that can embrace the most sophisticated report. How it works? Minimum and maximum values for all the values in the selected data column are specified. All the calculated values fall in the range from 0 to 100 percent. Then the condition and range values for each icon are set. If, for example, you select a group of three icons, each of the selected icon has its own sub-range. This provides an opportunity to identify every component with a value, depending on the sub-range. The picture below shows the Icon Set dialog.
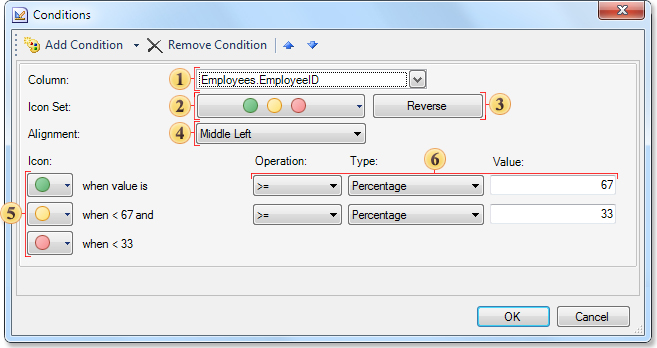
1. Field Column. Indicates data column from which values will be taken to fulfill the necessary condition.
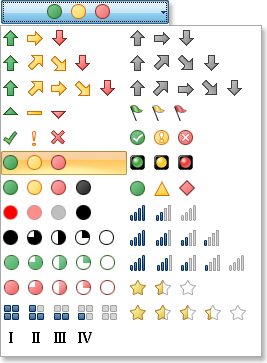
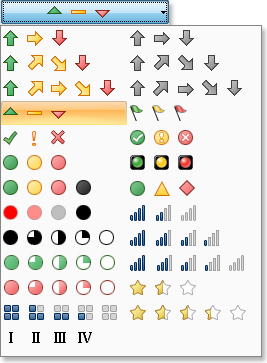
2. A menu to select a group of icons, the most appropriate for the report style:
3. Button Reverse. Used to set icons in the reverse order.
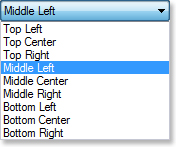
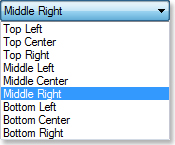
4. Field Alignment. Used to specify the icons location in a component.
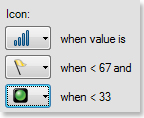
5. Field Icon. Shows order of selected icons, but also allows selecting an individual icon for each value in the report.
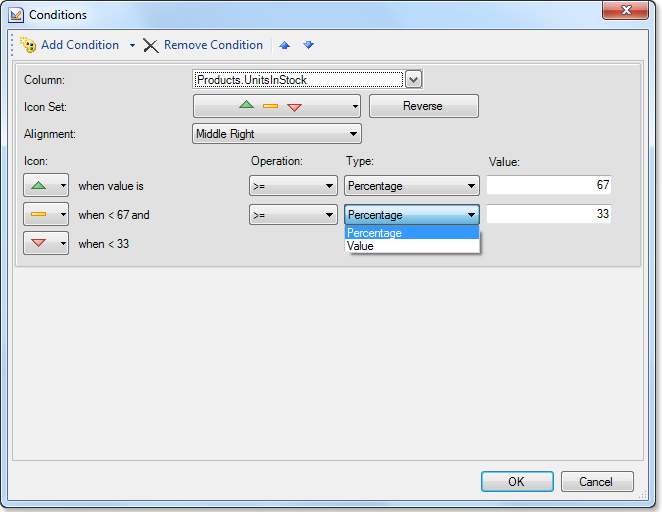
6. Filed Sub-Condition. It includes the fields: Operation, Type, Value. Each field line indicates a condition in which each value of the selected component is assigned to a particular icon.
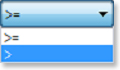
Field Operation. Used to change the operation type of the Sub-Condition. The picture below shows the Operation menu:
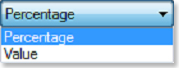
Field Type. Used to change the value type of the sub conditions. There are two values: Percentage and Value.
Field Value indicates the value of the sub-condition by which to sort.
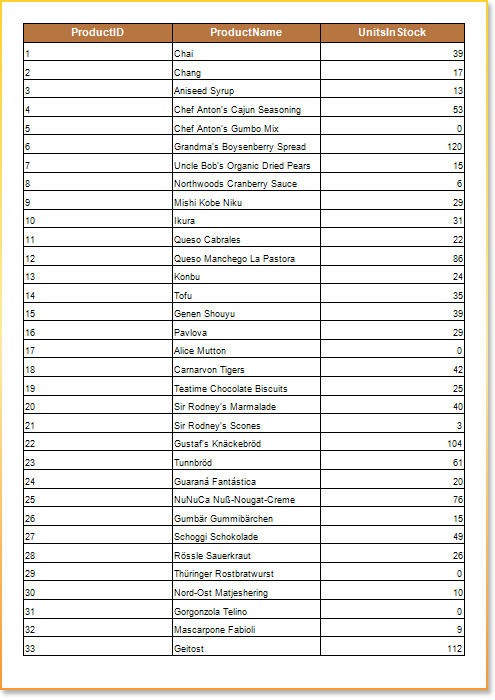
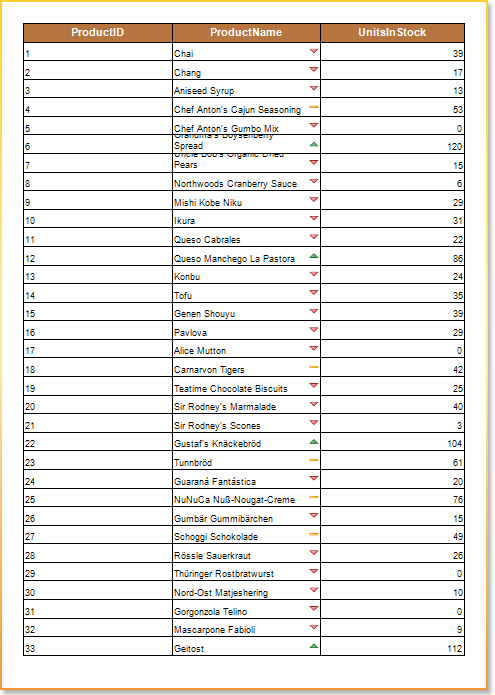
Let's review an example for better understanding how the Icon Set Condition works. In the example, we need to visually highlight the values by the ProductName column depending on the values located in column UnitsInStock. Before applying the Icon Set the report looks as shown in the picture:
Let's describe all the actions we need to do to apply the Icon Set Condition.
Select the component {Products.ProductName} in the DataBand to which the condition will be applied.

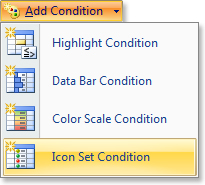
Clicking the button Conditions, invoke the conditions editor from the drop down list by selecting the Icon Set Condition.
Define the data column in the field Column.
Select an icons set from the list.
Set the position of icons in the component.
Select the type of operation, condition and set the values by which to sort.
After clicking Ok, go to the Preview. The result of applying the Icon Set Condition can be found in the picture below.
As a result of the articles series "Conditions - Understandable for Everyone" we can conclude that Conditions is not only convenient, useful, and absolutely easy to use tool in the reporting tool Stimulsoft Reports. Thanks to it, we can modify reports adding simplicity and clarity of its perception and rationalization, because now all the important elements will not remain without attention. If, before reading these articles, the Conditions tool caused difficulties or even stood aside, after reading this article series, this tool should become more than understandable. So, design reports, call the conditions editor and create!
The Icon Set Condition is one of the easiest Conditions type. It may seem that the Icon Set simply marks components in the report, but it is not correct. Besides the basic functions of "visual selection", this Condition sorts components by specified condition, assigning an icon to each data category. And the variety of icons is vast. Sorting itself can be performed from two to five values that can embrace the most sophisticated report. How it works? Minimum and maximum values for all the values in the selected data column are specified. All the calculated values fall in the range from 0 to 100 percent. Then the condition and range values for each icon are set. If, for example, you select a group of three icons, each of the selected icon has its own sub-range. This provides an opportunity to identify every component with a value, depending on the sub-range. The picture below shows the Icon Set dialog.
1. Field Column. Indicates data column from which values will be taken to fulfill the necessary condition.
2. A menu to select a group of icons, the most appropriate for the report style:
3. Button Reverse. Used to set icons in the reverse order.
4. Field Alignment. Used to specify the icons location in a component.
5. Field Icon. Shows order of selected icons, but also allows selecting an individual icon for each value in the report.
6. Filed Sub-Condition. It includes the fields: Operation, Type, Value. Each field line indicates a condition in which each value of the selected component is assigned to a particular icon.
Field Operation. Used to change the operation type of the Sub-Condition. The picture below shows the Operation menu:
Field Type. Used to change the value type of the sub conditions. There are two values: Percentage and Value.
Field Value indicates the value of the sub-condition by which to sort.
Let's review an example for better understanding how the Icon Set Condition works. In the example, we need to visually highlight the values by the ProductName column depending on the values located in column UnitsInStock. Before applying the Icon Set the report looks as shown in the picture:
Let's describe all the actions we need to do to apply the Icon Set Condition.
Select the component {Products.ProductName} in the DataBand to which the condition will be applied.
Clicking the button Conditions, invoke the conditions editor from the drop down list by selecting the Icon Set Condition.
Define the data column in the field Column.
Select an icons set from the list.
Set the position of icons in the component.
Select the type of operation, condition and set the values by which to sort.
After clicking Ok, go to the Preview. The result of applying the Icon Set Condition can be found in the picture below.
As a result of the articles series "Conditions - Understandable for Everyone" we can conclude that Conditions is not only convenient, useful, and absolutely easy to use tool in the reporting tool Stimulsoft Reports. Thanks to it, we can modify reports adding simplicity and clarity of its perception and rationalization, because now all the important elements will not remain without attention. If, before reading these articles, the Conditions tool caused difficulties or even stood aside, after reading this article series, this tool should become more than understandable. So, design reports, call the conditions editor and create!