Conditions - Understandable for Everyone. Article Four: Color Scale Condition. In this article we will continue our acquaintance with the Conditions of tool. Today we will review the Color Sсale Condition and its nuances.
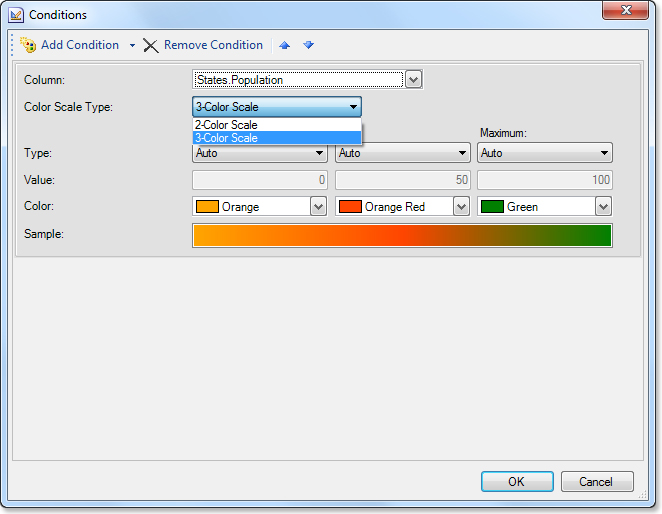
The Color Scale Condition allows you to highlight a component with color, in a manner of speaking, to add color to the drabness of the report. The color scheme of a component, its background, will be replaced in accordance with a condition. There are two ways of applying a Color scale: with two and three values. Their work is quite simple. If the color scale consists of two values, then the first value is the minimum one with a specific color assigned and a second value is the maximum one with a specific color (different from the first value) assigned too. The color scheme of other values in the range of maximum and minimum one will vary according to interpolation of two selected colors. Similar effect can be observed in the rainbow (smooth flowing of one color to another). Each component takes the hue, depending on how close the value is to the maximum and minimum one. Similarly, the Color Scale Condition works with three values, except that the color of the middle value is selected manually. The picture below shows the conditions editor.
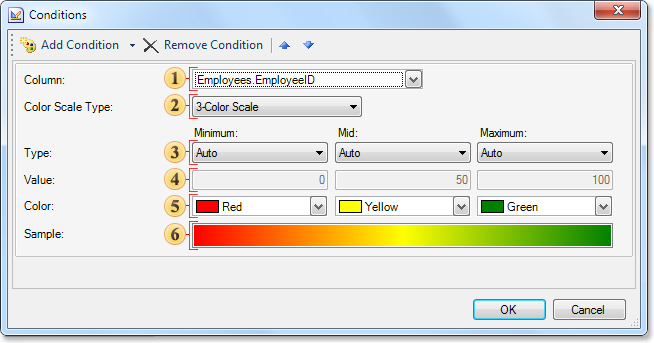
1) Field Column. Indicates data from which values will be taken to fulfill the necessary conditions.
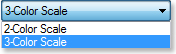
2) Field Color Scale Type. Used to select the type of color scheme: 2-Color Scale or 3-Color Scale.
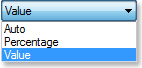
3) Filed Type. Specifies the type of the minimum and maximum values for the color scale: Auto, Percentage, Value. In case of a 3-Color Scale, the average value is selected from the same list.
4) Field Value. Used to set minimum, medium and maximum color scale values.
5) Field Color. Used to select color from the palette for the minimum, medium and maximum color scale.
6) Field Sample. Shows a user the color scale that will be used in the report, i.e. color gradient from minimum to medium and from medium to maximum. If you select a 2-color scale, then, in this field, color blend from a minimum to maximum value will be shown.
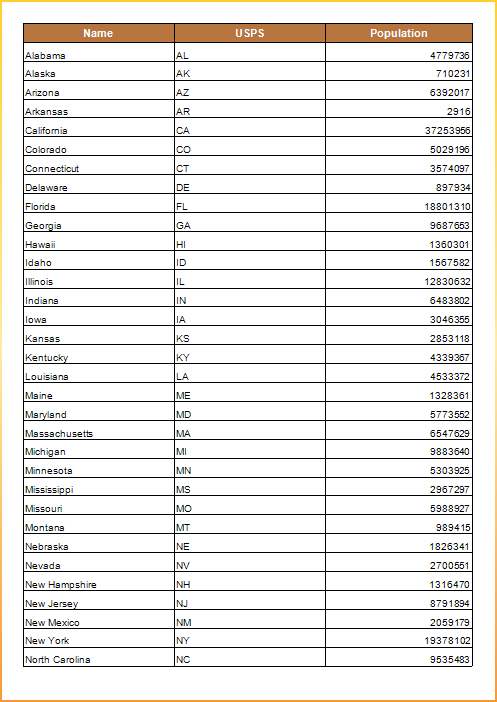
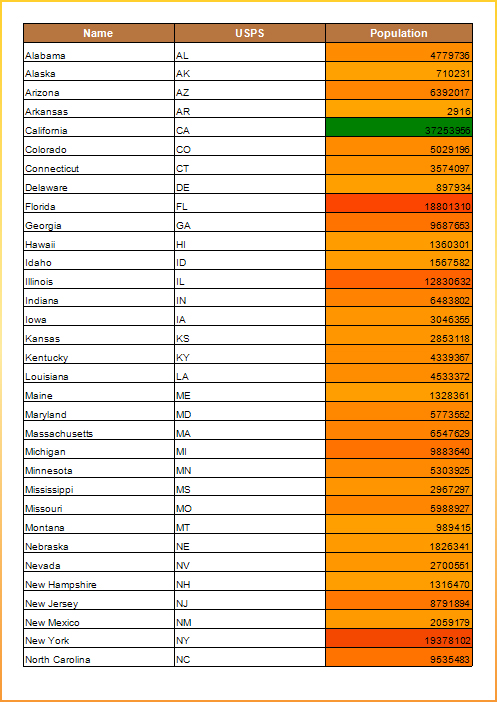
Let's review an example for better understanding how the Color Scale Condition work. For instance we have a report in which we should visually identify a data column with the population of the US states:
What should we do with the Color Scale Condition? Read an instruction below.
Select the text component {States.Population}, to which a condition will be applied.

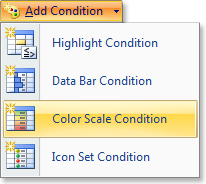
Clicking the Conditions, invoke an editor of conditions selecting the Color Scale Condition from the list.
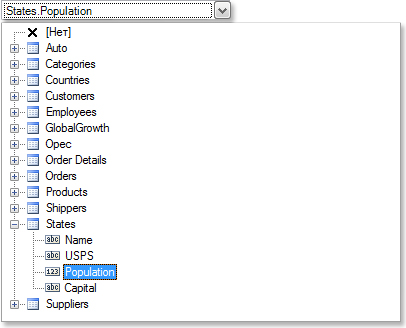
Indicate in the data column on which to focus our condition in the field Column of the conditions editor.
Specify the type of the color scale. In our case it is a 3-Color Scale. And also select the color for minimum, medium and maximum values.
Clicking the Conditions, invoke an editor of conditions, selecting the Color Scale Condition from the list. After clicking Ok, go to Preview. The result of applying the Color Scale Condition is a report, shown in the picture below:
In the next article we will close the theme of Conditions, and review the Icon Set.
The Color Scale Condition allows you to highlight a component with color, in a manner of speaking, to add color to the drabness of the report. The color scheme of a component, its background, will be replaced in accordance with a condition. There are two ways of applying a Color scale: with two and three values. Their work is quite simple. If the color scale consists of two values, then the first value is the minimum one with a specific color assigned and a second value is the maximum one with a specific color (different from the first value) assigned too. The color scheme of other values in the range of maximum and minimum one will vary according to interpolation of two selected colors. Similar effect can be observed in the rainbow (smooth flowing of one color to another). Each component takes the hue, depending on how close the value is to the maximum and minimum one. Similarly, the Color Scale Condition works with three values, except that the color of the middle value is selected manually. The picture below shows the conditions editor.
1) Field Column. Indicates data from which values will be taken to fulfill the necessary conditions.
2) Field Color Scale Type. Used to select the type of color scheme: 2-Color Scale or 3-Color Scale.
3) Filed Type. Specifies the type of the minimum and maximum values for the color scale: Auto, Percentage, Value. In case of a 3-Color Scale, the average value is selected from the same list.
4) Field Value. Used to set minimum, medium and maximum color scale values.
5) Field Color. Used to select color from the palette for the minimum, medium and maximum color scale.
6) Field Sample. Shows a user the color scale that will be used in the report, i.e. color gradient from minimum to medium and from medium to maximum. If you select a 2-color scale, then, in this field, color blend from a minimum to maximum value will be shown.
Let's review an example for better understanding how the Color Scale Condition work. For instance we have a report in which we should visually identify a data column with the population of the US states:
What should we do with the Color Scale Condition? Read an instruction below.
Select the text component {States.Population}, to which a condition will be applied.
Clicking the Conditions, invoke an editor of conditions selecting the Color Scale Condition from the list.
Indicate in the data column on which to focus our condition in the field Column of the conditions editor.
Specify the type of the color scale. In our case it is a 3-Color Scale. And also select the color for minimum, medium and maximum values.
Clicking the Conditions, invoke an editor of conditions, selecting the Color Scale Condition from the list. After clicking Ok, go to Preview. The result of applying the Color Scale Condition is a report, shown in the picture below:
In the next article we will close the theme of Conditions, and review the Icon Set.