Creating Report at Runtime
Unsere Beispiele der Projekte und Berichtsvorlagen helfen Ihnen, die Grundlagen der Arbeit mit unserer Software zu erlernen.This sample project shows the possibility of creating a report in runtime. After you create a report using the code, you can display it in the WPF viewer. For a start, initialize components:
All necessary actions can be done in the
Then we need to create the report components. First, add the Header Band to the report page with the Text component that will display the title:
Next, add the Data Band with the Text component to which add an expression. This expression combines the Line number and the CompanyName data column from the Customers data source:
Finally, add the page Footer Band with the Text component which displays the text at the bottom of the page. Last action is a call of the WPF viewer which will build and display the report automatically:
Auf dem Screenshot unten Sie können das Ergebnis des Beispiel-Codes ansehen:
public MainWindow()
{
	InitializeComponent();
}
All necessary actions can be done in the
Button_Click() event of the application. In the first place create the new report object, register the data and synchronize it with the report dictionary:
private void Button_Click(object sender, RoutedEventArgs e)
{
	var report = new StiReport();

	// Add data to datastore
	var dataSet = StiJsonToDataSetConverterV2.GetDataSetFromFile(@"Data\Demo.json");
	report.RegData(dataSet);

	// Fill dictionary
	report.Dictionary.Synchronize();

...
Then we need to create the report components. First, add the Header Band to the report page with the Text component that will display the title:
...

	var page = report.Pages[0];

	// Create HeaderBand
	var headerBand = new StiHeaderBand();
	headerBand.Height = 0.5;
	headerBand.Name = "HeaderBand";
	page.Components.Add(headerBand);

	// Create text on header
	var headerText = new StiText(new RectangleD(0, 0, 5, 0.5));
	headerText.Text = "CompanyName";
	headerText.HorAlignment = StiTextHorAlignment.Center;
	headerText.Name = "HeaderText";
	headerText.Brush = new StiSolidBrush(System.Drawing.Color.LightGreen);
	headerBand.Components.Add(headerText);

...
Next, add the Data Band with the Text component to which add an expression. This expression combines the Line number and the CompanyName data column from the Customers data source:
...

	// Create Databand
	var dataBand = new StiDataBand();
	dataBand.DataSourceName = "Customers";
	dataBand.Height = 0.5;
	dataBand.Name = "DataBand";
	page.Components.Add(dataBand);

	// Create text
	var dataText = new StiText(new RectangleD(0, 0, 5, 0.5));
	dataText.Text = "{Line}.{Customers.CompanyName}";
	dataText.Name = "DataText";
	dataBand.Components.Add(dataText);

...
Finally, add the page Footer Band with the Text component which displays the text at the bottom of the page. Last action is a call of the WPF viewer which will build and display the report automatically:
...
// Create FooterBand
var footerBand = new StiFooterBand();
footerBand.Height = 0.5;
footerBand.Name = "FooterBand";
page.Components.Add(footerBand);
// Create text on footer
var footerText = new StiText(new RectangleD(0, 0, 5, 0.5));
footerText.Text = "Count - {Count()}";
footerText.HorAlignment = StiTextHorAlignment.Right;
footerText.Name = "FooterText";
footerText.Brush = new StiSolidBrush(System.Drawing.Color.LightGreen);
footerBand.Components.Add(footerText);
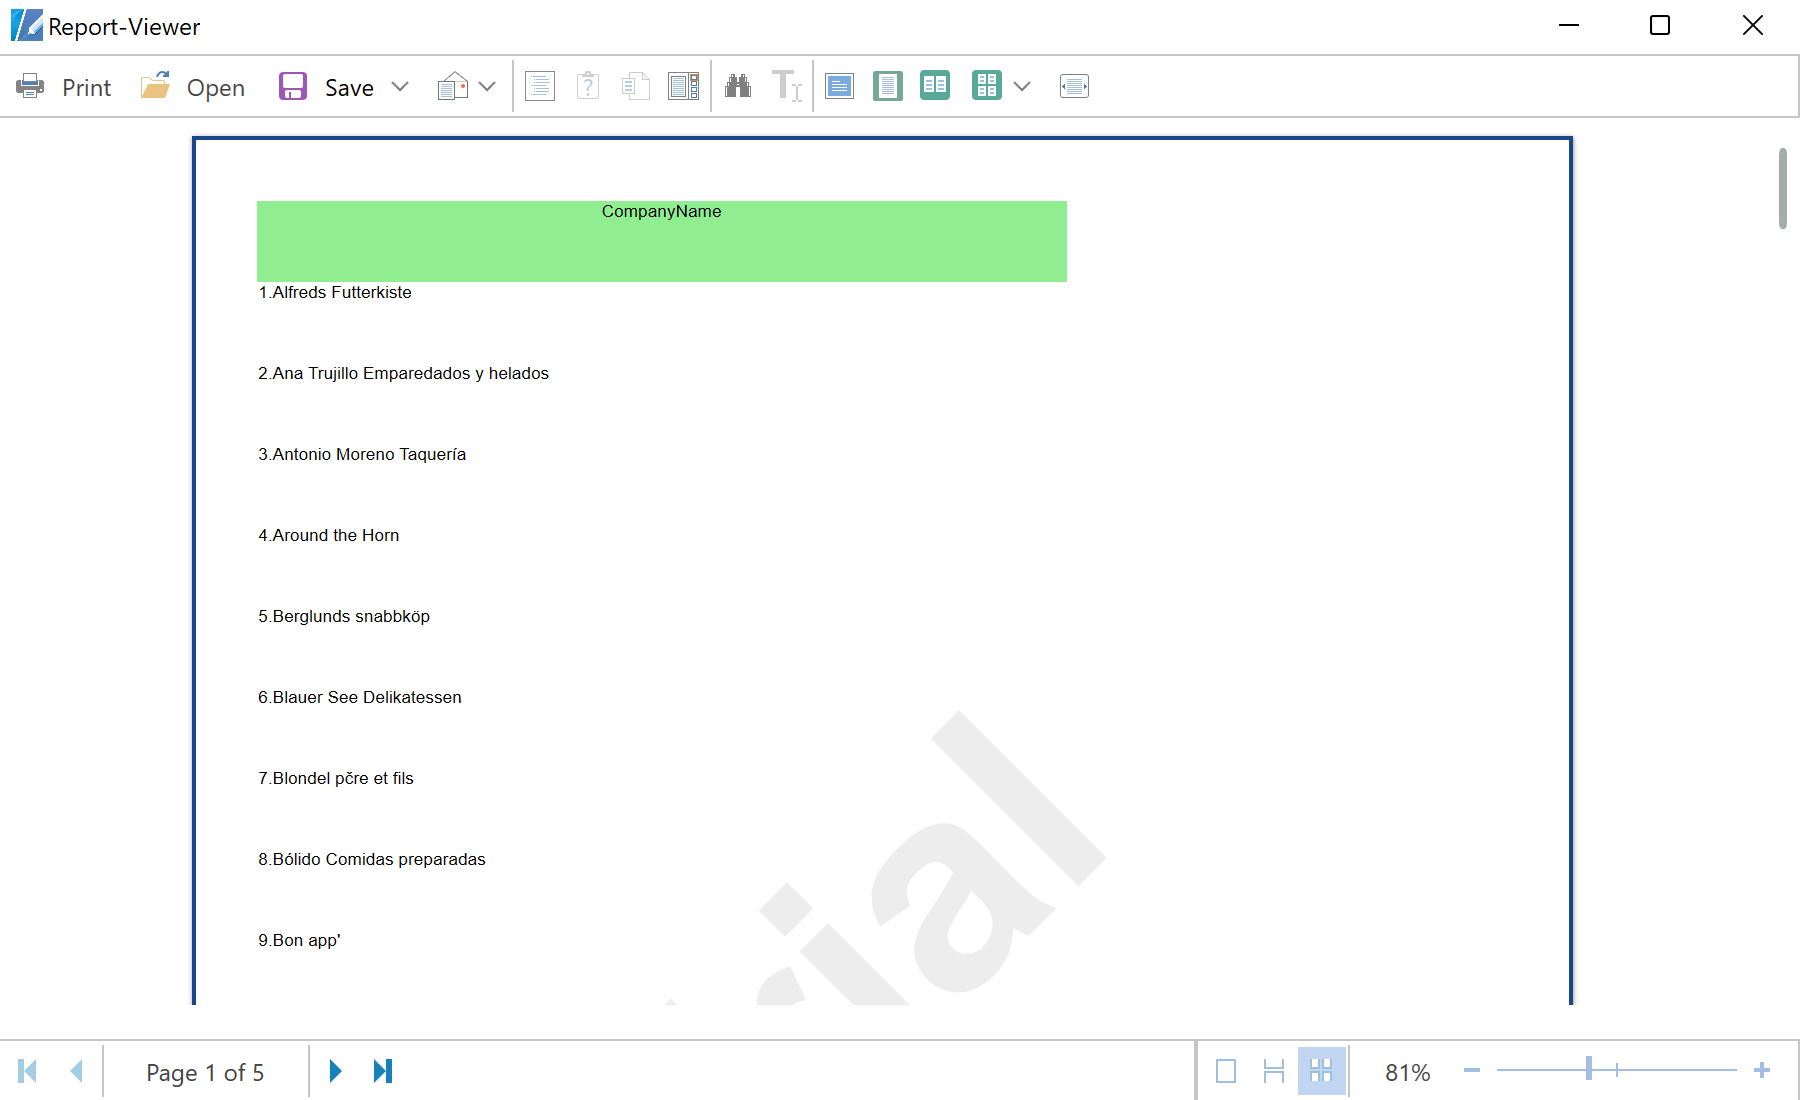
report.ShowWithWpf();
}Auf dem Screenshot unten Sie können das Ergebnis des Beispiel-Codes ansehen: