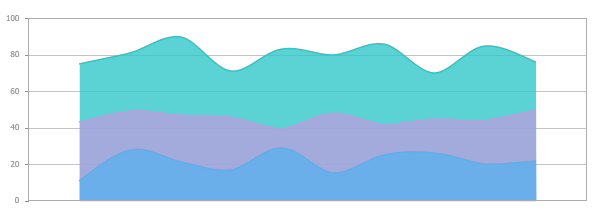
The style of the report affects on how information visually looks in the report. This is especially important when it comes to graphic components. In the 2015.3 release, we have added new styles for data visualization of components such as charts and gauges.

new styles for charts and gauges 3
New Styles for Charts and Gauges
By using this website, you agree to the use of cookies for analytics and personalized content. Cookies store useful information on your computer to help us improve efficiency and usability. For more information, please read the privacy policy and cookie policy.