Dear existing and potential users of the software products Stimulsoft Reports! We continue our series of articles on the optimization of reports. In the previous article of this series we dealt with the theme of creating reports, but as the work with reports does not end with its rendering, so optimization does not end with optimization processes when designing reports.
Today we will share you some tips to help you be able to not only significantly improve the appearance of the final report, but also reduce the amount of resources used, as well as speed up work with reports. Итак, оптимизация экспорта отчетов:
Borders and grid alignment
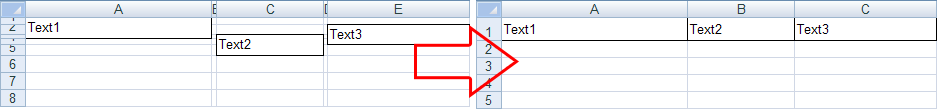
When exporting reports, our users are often facing with many extra columns in the Excel table. But are they superfluous? After all, each cell corresponds to the border of any component on the page. Otherwise, you cannot display a lot of components scattered across the page. Therefore, when using a table export mode, it is recommended to use the following tips: - Use the button Align to Grid. This will reduce the number of rows and columns in the ready file. The image below shows it very clearly: when exporting, the report on the left will have 25 cells, and the report on the right - only 3. This will help to avoid the very small gaps between components (some formats "do not like", when columns of the table are obtained by a very small size); - Place components in a Data band at the same level. This will reduce the number of rows and columns in the output file as in the previous section.
Using a Data band instead of Tables
The data can be output from the data source in a report using the Table component or the Data band. The Table is a complex component that is based on the Data band. In the process of rendering a report, the report engine itself decomposes the Table into a Header, Data band, and Footer. When rendering a simple report as a solid table, there is no significant difference between the Table and Data band components, in mdc-files. When rendering a complex report, for example, a table with blank columns, merged with cells in the header and footers etc. The difference might be more noticeable. The Data band component is more flexible in using (although more complex) that allows you to create a more optimized template. For example, for an empty column you may not add a text component, there is no need to merge cells, etc. In the table, an empty cell is not empty and processing and storage requires additional time and resources. Therefore, when you use the Table component, time for the report creation may increase, and the size of the .mdc report file can be larger.
Using graphic primitives
Exporting reports can be faster and easier when you can use graphic primitives instead of the more "heavy" component Shape. Graphic primitives are vertical and horizontal lines, rectangles that are used to create borders of components. A shape is often exported to other formats such as picture, which significantly increases the volume of the exported report.
RichText component
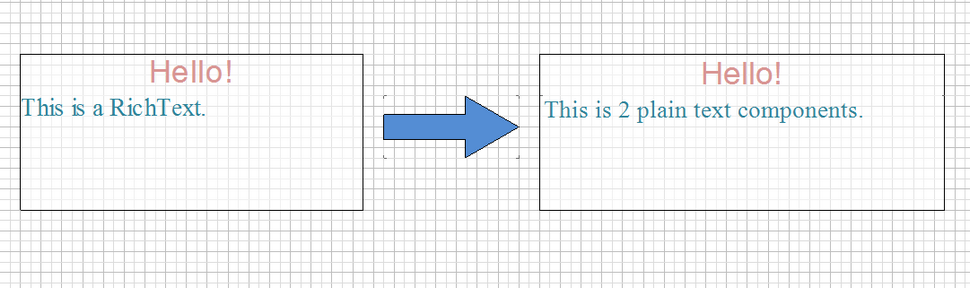
To speed up the export of the rendered report, we recommend you use several ordinary components instead of the RichText component. Since the RichText component is complex, there is the complexity of its processing, for example, because of the use of the system libraries that handle the report quite a long time. Also many formats do not recognize such a text, and it will have to export it as a picture, which can significantly increase the size of the output file. Then there are certain difficulties in the editing of the document.
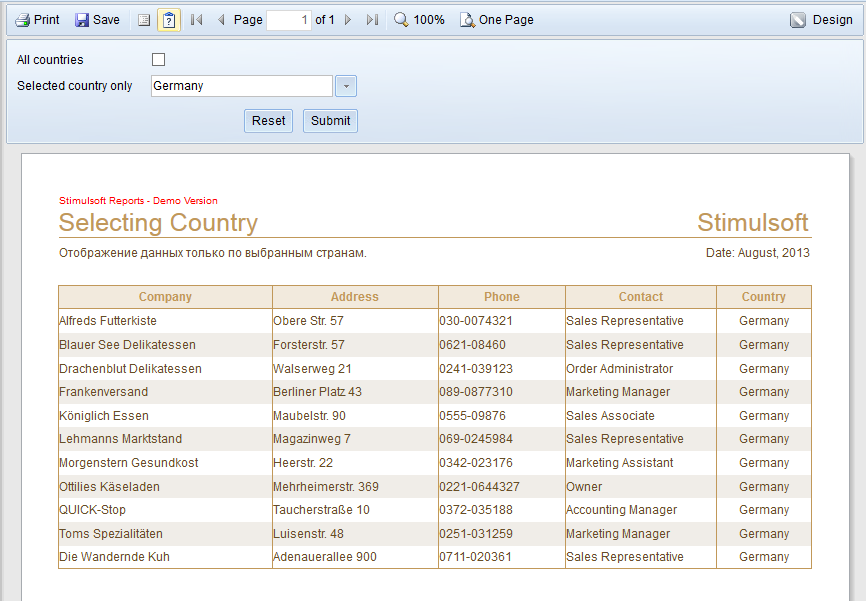
We should also mention the process of working with reports in the Web - directly in the web browser. This process goes only by means of the browser itself. Some manufacturers use reporting tools Active-X-components to extend the functionality, but these components work only in Internet Explorer. We do not limit our customers which web browser to choose for working with reports. However, we recommend our users do not build very large reports, multi-page reports with a huge amount of data in the web browser. It is caused not only by the fact that the means of the browser considerably limit capabilities for working with reports, but also by the fact that the report rendering goes on web servers, which often have limited resources. For large reports, we recommend splitting them up into smaller reports, and use filters to limit the amount of data displayed. It is unlikely that users will bring pleasure to flip through hundreds of pages in a browser.
Today we will share you some tips to help you be able to not only significantly improve the appearance of the final report, but also reduce the amount of resources used, as well as speed up work with reports. Итак, оптимизация экспорта отчетов:
Borders and grid alignment
When exporting reports, our users are often facing with many extra columns in the Excel table. But are they superfluous? After all, each cell corresponds to the border of any component on the page. Otherwise, you cannot display a lot of components scattered across the page. Therefore, when using a table export mode, it is recommended to use the following tips: - Use the button Align to Grid. This will reduce the number of rows and columns in the ready file. The image below shows it very clearly: when exporting, the report on the left will have 25 cells, and the report on the right - only 3. This will help to avoid the very small gaps between components (some formats "do not like", when columns of the table are obtained by a very small size); - Place components in a Data band at the same level. This will reduce the number of rows and columns in the output file as in the previous section.
Using a Data band instead of Tables
The data can be output from the data source in a report using the Table component or the Data band. The Table is a complex component that is based on the Data band. In the process of rendering a report, the report engine itself decomposes the Table into a Header, Data band, and Footer. When rendering a simple report as a solid table, there is no significant difference between the Table and Data band components, in mdc-files. When rendering a complex report, for example, a table with blank columns, merged with cells in the header and footers etc. The difference might be more noticeable. The Data band component is more flexible in using (although more complex) that allows you to create a more optimized template. For example, for an empty column you may not add a text component, there is no need to merge cells, etc. In the table, an empty cell is not empty and processing and storage requires additional time and resources. Therefore, when you use the Table component, time for the report creation may increase, and the size of the .mdc report file can be larger.
Using graphic primitives
Exporting reports can be faster and easier when you can use graphic primitives instead of the more "heavy" component Shape. Graphic primitives are vertical and horizontal lines, rectangles that are used to create borders of components. A shape is often exported to other formats such as picture, which significantly increases the volume of the exported report.
RichText component
To speed up the export of the rendered report, we recommend you use several ordinary components instead of the RichText component. Since the RichText component is complex, there is the complexity of its processing, for example, because of the use of the system libraries that handle the report quite a long time. Also many formats do not recognize such a text, and it will have to export it as a picture, which can significantly increase the size of the output file. Then there are certain difficulties in the editing of the document.
We should also mention the process of working with reports in the Web - directly in the web browser. This process goes only by means of the browser itself. Some manufacturers use reporting tools Active-X-components to extend the functionality, but these components work only in Internet Explorer. We do not limit our customers which web browser to choose for working with reports. However, we recommend our users do not build very large reports, multi-page reports with a huge amount of data in the web browser. It is caused not only by the fact that the means of the browser considerably limit capabilities for working with reports, but also by the fact that the report rendering goes on web servers, which often have limited resources. For large reports, we recommend splitting them up into smaller reports, and use filters to limit the amount of data displayed. It is unlikely that users will bring pleasure to flip through hundreds of pages in a browser.