Cloud
Облачный сервис для быстрого и эффективного анализа и визуализации данных для вашего бизнеса без необходимости создания своих приложений и программирования.
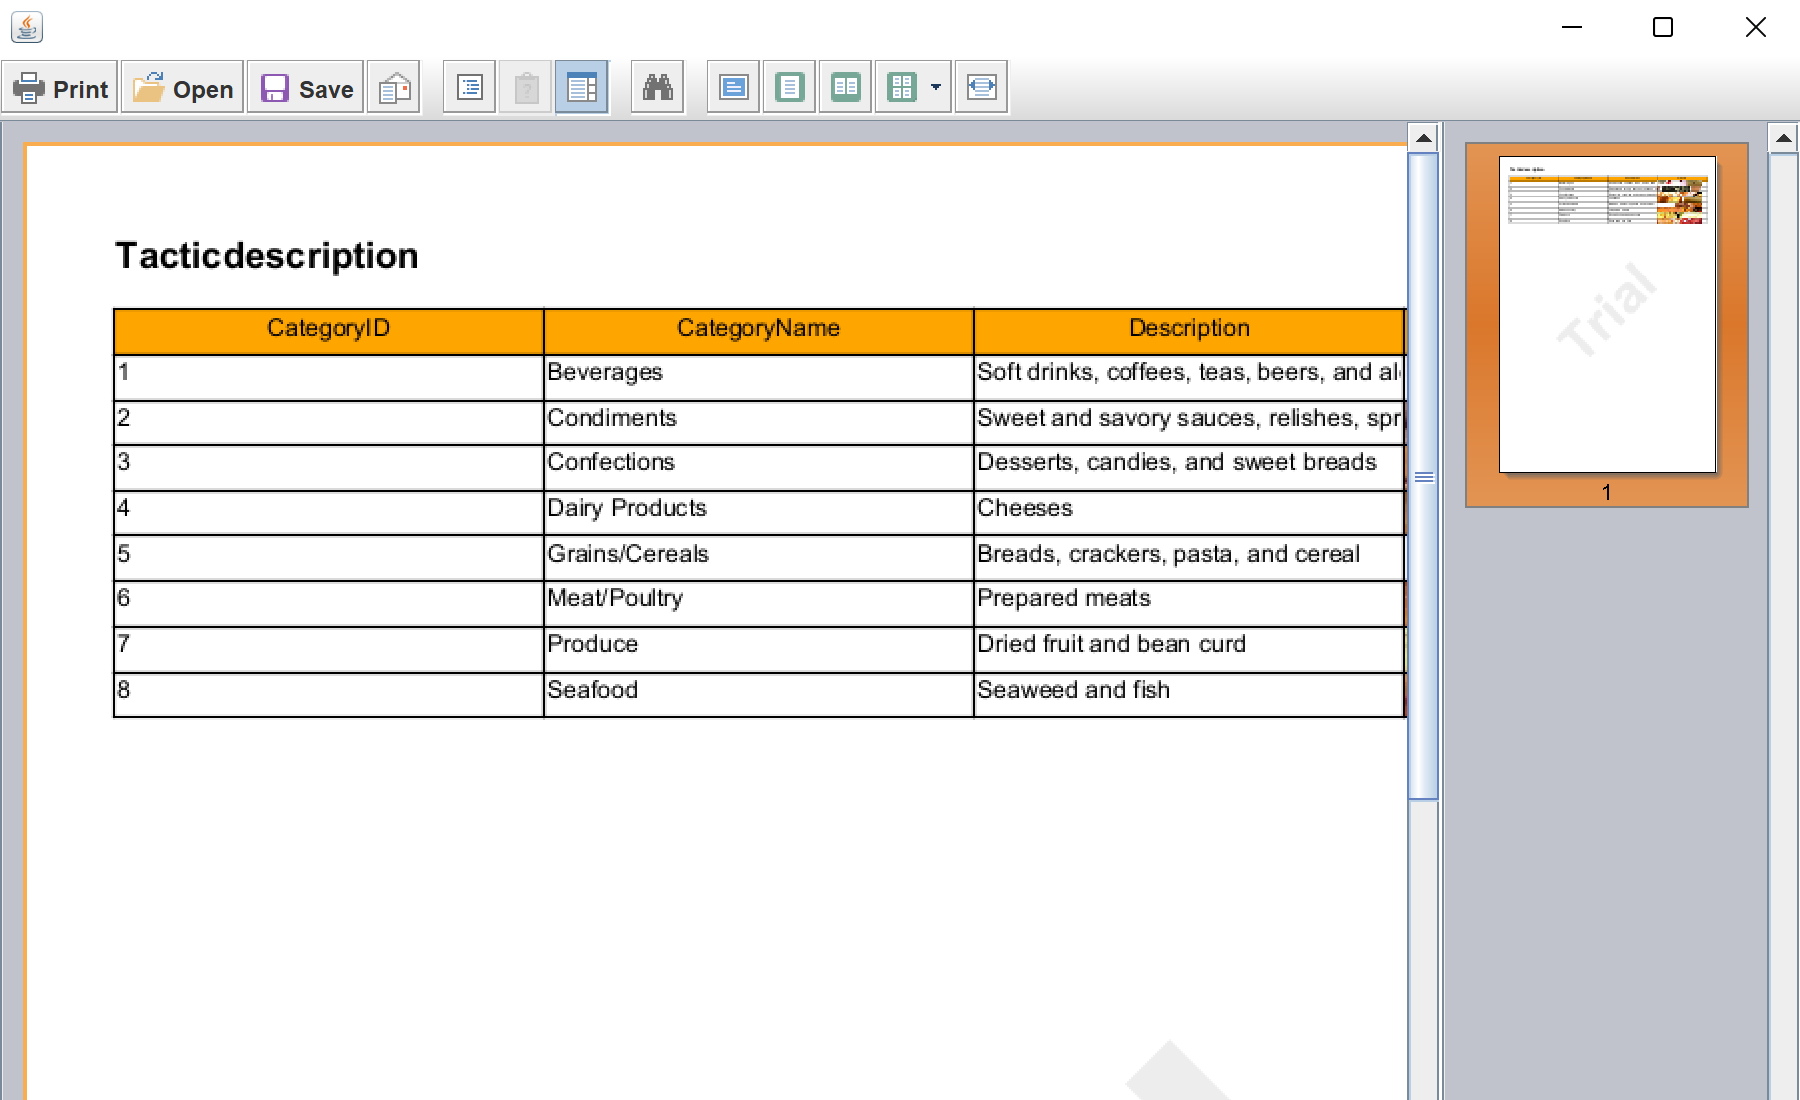
JFrame, set the necessary options and add the viewer control:
public class CreateReport extends JPanel {

	private static final long serialVersionUID = 330448692680237867L;
	private static final Dimension FRAME_SIZE = new Dimension(800, 800);

	public static void main(final String[] args) {
		SwingUtilities.invokeLater(new Runnable() {
			public void run() {
				try {
					JFrame frame = new JFrame();
					frame.add(new CreateReport(frame));
					frame.setSize(FRAME_SIZE);
					frame.setLocationRelativeTo(null);
					frame.setDefaultCloseOperation(JFrame.EXIT_ON_CLOSE);
					frame.setVisible(true);
				} catch (Throwable e) {
					StiExceptionProvider.show(e, null);
				}
			}
		});
	}

	public CreateReport(final JFrame parentFrame) throws FileNotFoundException {
		setLayout(new BoxLayout(this, BoxLayout.Y_AXIS));
		setPreferredSize(FRAME_SIZE);
		StiViewerFx viewerPanel = new StiViewerFx(parentFrame);
		add(viewerPanel);

......
StiReport report = new StiReport();
StiPage page = new StiPage(report);
report.getPages().add(page);
page.setName(StiNameCreation.createName(report, StiNameCreation.generateName(page)));
String xsdPath = "/samples/Demo.xsd";
StiXmlDatabase xmlDatabase = new StiXmlDatabase("Demo",
StiResourceUtil.getStream(xsdPath), StiResourceUtil.getStream("/samples/Demo.xml"));
report.setDictionary(new StiDictionary(report));
report.getDictionary().getDatabases().add(xmlDatabase);
......
StiXmlTableFieldsRequest tables = StiDataColumnsUtil.parceXSDSchema(StiResourceUtil.getStream(xsdPath));
StiDataTableSource tableSource = null;
for (StiXmlTable table : tables.getTables()) {
if (table.getName().equals("Categories")) {
tableSource = new StiDataTableSource("Demo." + table.getName(), table.getName(), table.getName());
tableSource.setColumns(new StiDataColumnsCollection());
for (StiSqlField field : table.getColumns()) {
StiDataColumn column = new StiDataColumn(field.getName(), field.getName(), field.getSystemType());
tableSource.getColumns().add(column);
}
tableSource.setDictionary(report.getDictionary());
report.getDictionary().getDataSources().add(tableSource);
}
}
......
// Create TitleBand
StiHeaderBand titleBand = new StiHeaderBand();
titleBand.setHeight(0.85);
titleBand.setName("TitleBand");
page.getComponents().add(titleBand);
// Create Title text on header
StiText headerText = new StiText(new StiRectangle(0, 0, page.getWidth(), 0.85));
headerText.setTextInternal("Tacticdescription");
headerText.setHorAlignment(StiTextHorAlignment.Left);
headerText.setName("TitleHeader");
headerText.setFont(new StiFont("Arial", 12F, StiFontStyle.Bold));
titleBand.getComponents().add(headerText);
// Create HeaderBand
StiHeaderBand headerBand = new StiHeaderBand();
headerBand.setHeight(0.5);
headerBand.setName("HeaderBand");
page.getComponents().add(headerBand);
......
double pos = 0;
double columnWidth = page.getWidth() / tableSource.getColumns().size();
Integer nameIndex = 1;
for (StiDataColumn dataColumn : tableSource.getColumns()) {
// Create text on header
StiText hText = new StiText(new StiRectangle(pos, 0, columnWidth, 0.5));
hText.setTextInternal(dataColumn.getName());
hText.setHorAlignment(StiTextHorAlignment.Center);
hText.setName("HeaderText" + nameIndex.toString());
hText.setBrush(new StiSolidBrush(StiColorEnum.Orange.color()));
hText.getBorder().setSide(StiBorderSides.All);
headerBand.getComponents().add(hText);
if (dataColumn.getName().equals("Picture")) {
StiImage dataImage = new StiImage(new StiRectangle(pos, 0, columnWidth, 0.5));
dataImage.setDataColumn("Categories." + dataColumn.getName());
dataImage.setName("DataImage" + nameIndex.toString());
dataImage.getBorder().setSide(StiBorderSides.All);
dataBand.getComponents().add(dataImage);
} else {
StiText dataText = new StiText(new StiRectangle(pos, 0, columnWidth, 0.5));
dataText.setText("{Categories." + dataColumn.getName() + "}");
dataText.setName("DataText" + nameIndex.toString());
dataText.getBorder().setSide(StiBorderSides.All);
dataBand.getComponents().add(dataText);
}
pos = pos + columnWidth;
nameIndex++;
}
......
report.Render();
viewerPanel.getStiViewModel().getEventDispatcher().dispatchStiEvent(
new StiViewCommonEvent(StiViewCommonEvent.DOCUMENT_FILE_LOADED, new StiDocument(report), null));
}