Creating Report with Table at Runtime
Наши примеры проектов и шаблоны отчётов помогут Вам разобраться в основах работы с нашими продуктами.This example shows how to create a simple report with table in Runtime. In this sample project you can set some properties for the table. Using the Table component, you can create a report with the title and total without other bands. In this case, some of table rows will be Header and Footer of data. First, create a new report and connect to data:
Next, add the Table component on the report page:
Next, define a number of Columns and Rows in the table:
Next, define a number of rows of the Header and rows of the Footer in the table:
Next, define other options of the Table component:
Next, add a text of the header and references to the data fields in cells:
Next, add a function of total in cells:
In the end, render the report and show it in the viewer:
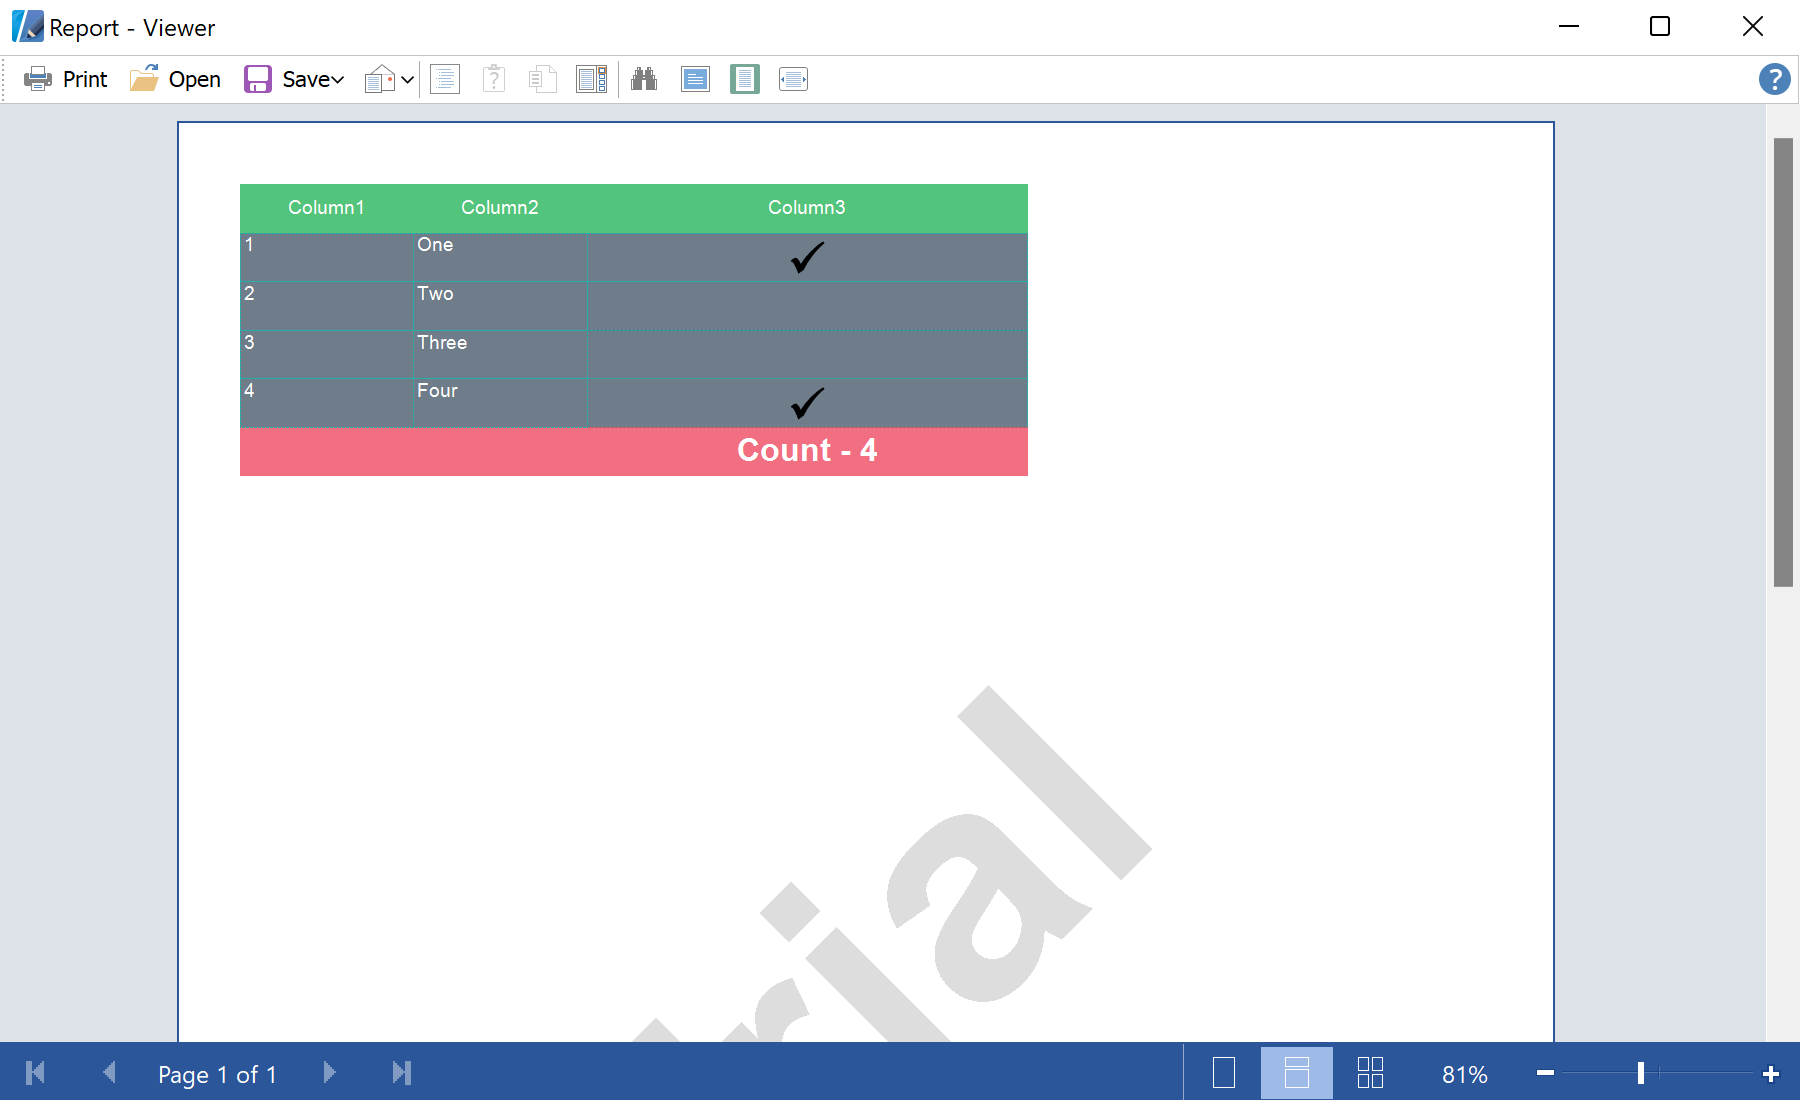
На скриншоте ниже Вы можете увидеть результат выполнения данного кода:
private void PrintDataGrid(DataGrid sender)
{
	DataView dataView = (DataView)sender.DataSource;
	StiReport report = new StiReport();
	report.ScriptLanguage = StiReportLanguageType.CSharp;

	// Add data to datastore
	report.RegData("view", dataView);

	// Fill dictionary
	report.Dictionary.Synchronize();

...
Next, add the Table component on the report page:
...

	StiPage page = report.Pages.Items[0];

	// Create Table
	StiTable table = new StiTable();
	table.Name = "Table1";
	if (rbAWNone.Checked)
		table.AutoWidth = StiTableAutoWidth.None;
	else if (rbAWPage.Checked)
		table.AutoWidth = StiTableAutoWidth.Page;
	else
	table.AutoWidth = StiTableAutoWidth.Table;

	if (rbAWTNone.Checked)
		table.AutoWidthType = StiTableAutoWidthType.None;
	else if (rbAWTFullTable.Checked)
		table.AutoWidthType = StiTableAutoWidthType.FullTable;
	else table.AutoWidthType = StiTableAutoWidthType.LastColumns;

...
Next, define a number of Columns and Rows in the table:
...

	table.ColumnCount = 3;
	table.RowCount = 3;

...
Next, define a number of rows of the Header and rows of the Footer in the table:
...

	table.HeaderRowsCount = 1;
	table.FooterRowsCount = 1;

...
Next, define other options of the Table component:
...

	table.Width = page.Width;
	table.Height = page.GridSize * 12;
	table.DataSourceName = "view" + dataView.Table.TableName;
	page.Components.Add(table);
	table.CreateCell();
	table.TableStyleFX = new StiTable27StyleFX();
	table.TableStyle = Stimulsoft.Report.Components.Table.StiTableStyle.Style59;

	int indexHeaderCell = 0;
	int indexDataCell = 3;

...
Next, add a text of the header and references to the data fields in cells:
...

	foreach (DataColumn column in dataView.Table.Columns)
	{
		// Set text on header
		StiTableCell headerCell = table.Components[indexHeaderCell] as StiTableCell;
		headerCell.Text.Value = column.Caption;
		headerCell.HorAlignment = StiTextHorAlignment.Center;
		headerCell.VertAlignment = StiVertAlignment.Center;

		StiTableCell dataCell = table.Components[indexDataCell] as StiTableCell;
		dataCell.Text.Value = "{view" + dataView.Table.TableName + "." +
			Stimulsoft.Report.CodeDom.StiCodeDomSerializator.ReplaceSymbols(column.ColumnName) + "}";
		dataCell.Border = new StiBorder(StiBorderSides.All, Color.FromArgb(32, 178, 170), 1, StiPenStyle.Dash);

		indexHeaderCell++;
		indexDataCell++;
	}

	StiTableCell dataCheckBoxCell = table.Components[indexDataCell - 1] as StiTableCell;
	dataCheckBoxCell.CellType = StiTablceCellType.CheckBox;

...
Next, add a function of total in cells:
...

	// Set text on footer
	StiTableCell footerCell = table.Components[table.Components.Count - 1] as StiTableCell;
	footerCell.Text.Value = "Count - {Count()}";
	footerCell.Font = new Font("Arial", 15, FontStyle.Bold);
	footerCell.VertAlignment = StiVertAlignment.Center;
	footerCell.HorAlignment = StiTextHorAlignment.Center;

...
In the end, render the report and show it in the viewer:
...

	// Render without progress bar
	report.Render(false);
	report.Show();
}
На скриншоте ниже Вы можете увидеть результат выполнения данного кода: