About What All This?
Now it is time to discuss such a possibility in the reporting tool like Conditions. This tool is important and frequently used, so it needs detailed description. This article will reveal all the secrets and drowned flows of using Conditions, understanding the usage of which will be difficult to imagine how many different actions can be obtained.
Why We Need This?
There are situations when a report contains multiple data but it is needed to pay attention only to specified information. What should I do? Users are sitting and laboriously, manually, "separate the wheat from the chaff," visually searching of the necessary data, but it is difficult, long and extremely unproductive! Efficiency of such work purposefully moving towards zero result. You can spend your own time, but you can learn the principle of operation of the Conditions tool in Stimulsoft Reports. As it was already clear, this tool is aimed at visual formatting of the output data and (or) changing their visual parameters according to a specified condition.
Naturally, there are several ways of work: from the visual designing to ability to hide a component on the report page. Selecting a component on the page of a rendered report will make it much easier for report users, because the component will be visually highlighted, without spending too much time of a user for viewing the entire page, each row, each column searching for relevant information. In simple phrase, if a user wants to mark or make components visible in the total number of rows, it can be quite simply done: specify the condition under which data will be selected, and design the appearance, which will be applied to a component, if this condition is true. In accordance with your desire you may change the font, fill components with color, and draw histograms, icon sets, color scales and other things on your cultivated taste, up to using the style of the report.
In addition to the visual selection of page component, there is another advantage of using Conditions - marked improvement in visual perception of a report by graphic demonstration of selected components in the report. Many might think that Conditions work similar to Filtration, but that is not the case. Despite the fact that both instruments select necessary components from the total amount of information by specified conditions, the final result is much different. After using Filtration in the report only those data that fit the criteria for selection are output. The remaining data rows are not displayed at all. In the case of Conditions, data rows remain in a report, but their appearance is changed, without modifying the functional purpose of the report. Conditions is a higher-level tool than Filtration, because Filtration can only reduce the number of printed data rows. The main purpose of Conditions is formatting but this tool also provides the ability to filter data. Let’s consider some of the features of Conditions. For example we need to summarize by the year, quarter, month, etc. For visualization, you can select positive values of totals in green and negative in red. This can be done using Conditions.
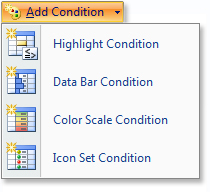
The Conditions property have all components, pages and bands. But keep in mind that the Conditions property is not available for the Report, because it cannot be disabled and has no visual design options. Conditions is divided into the following types: Highlight Condition, Data Bar Condition, Color Scale Condition and Icon Set Condition.

Each of these types has its own distinctive features: Highlight Condition is used to set the font and background style; Data Bar Condition is used for graphical dynamic changing of values; Color Scale Condition is used for selecting a component color, which varies from a minimum value to a maximum one; Icon Set Condition is used to mark a component with an icon, on which the condition is covered. All of the above conditions are working with components placed on the band, besides the Highlight Condition which can work not only with the component but also directly with the band.
Where Can We Find And How to Use This?
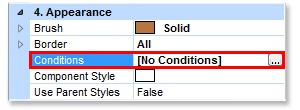
To use the Conditions, you must know where it is located. The most logical way resulting from the name "Conditions property" is the properties panel on the right side of the screen. For example, for a text component as well as for a DataBand, the Conditions property is located in the Appearance tab on the properties panel.
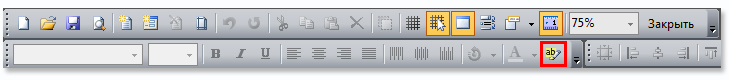
Also, the window of the Conditions property can be invoked by clicking the Conditions on the control panel. The exact location of this button depends on the type of UI. When using Standard UI, the Conditions button is in the end of the Formatting toolbar.
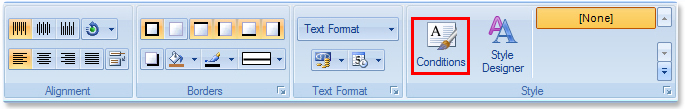
When using the Ribbon 2007 UI, Conditions can be found on the Home tab, in the Styles group.
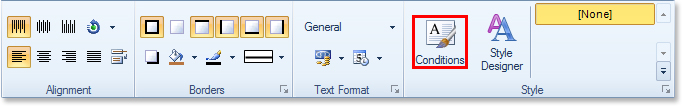
In Ribbon 2010 UI, Conditions is also located as in the Ribbon 2007 UI - on the Home tab, in the Styles group.
Sorted out with location. Then, when you click the corresponding button, in the Conditions Editor box, select the desired options and set parameters.
Several buttons can be found in the Condition dialog box:
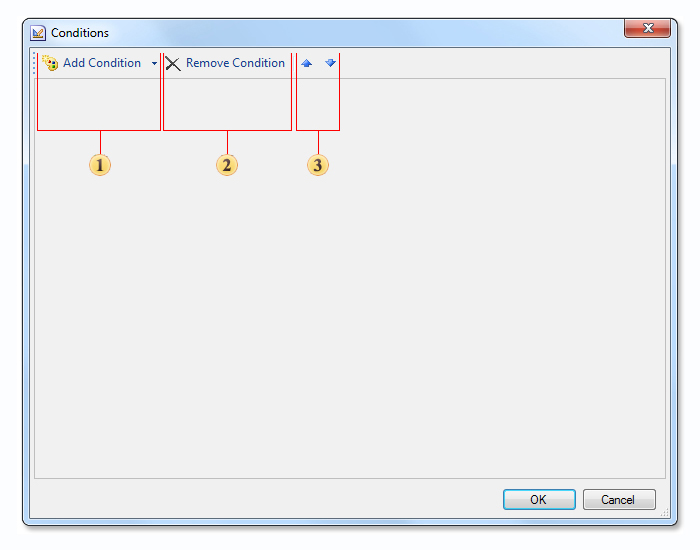
1) Add Condition. This button adds a new condition to the list of conditions for the selected component. For each component it is possible to create one, two, three, four and more conditions. There are no restrictions in this way.
2) Remove Condition. Removes the previously selected condition from the list of conditions of a component.
3) Buttons which are used to change the order of conditions.
This article is the first one which covers the features of Conditions. In the next article, we will review Highlight Condition.
Now it is time to discuss such a possibility in the reporting tool like Conditions. This tool is important and frequently used, so it needs detailed description. This article will reveal all the secrets and drowned flows of using Conditions, understanding the usage of which will be difficult to imagine how many different actions can be obtained.
Why We Need This?
There are situations when a report contains multiple data but it is needed to pay attention only to specified information. What should I do? Users are sitting and laboriously, manually, "separate the wheat from the chaff," visually searching of the necessary data, but it is difficult, long and extremely unproductive! Efficiency of such work purposefully moving towards zero result. You can spend your own time, but you can learn the principle of operation of the Conditions tool in Stimulsoft Reports. As it was already clear, this tool is aimed at visual formatting of the output data and (or) changing their visual parameters according to a specified condition.
Naturally, there are several ways of work: from the visual designing to ability to hide a component on the report page. Selecting a component on the page of a rendered report will make it much easier for report users, because the component will be visually highlighted, without spending too much time of a user for viewing the entire page, each row, each column searching for relevant information. In simple phrase, if a user wants to mark or make components visible in the total number of rows, it can be quite simply done: specify the condition under which data will be selected, and design the appearance, which will be applied to a component, if this condition is true. In accordance with your desire you may change the font, fill components with color, and draw histograms, icon sets, color scales and other things on your cultivated taste, up to using the style of the report.
In addition to the visual selection of page component, there is another advantage of using Conditions - marked improvement in visual perception of a report by graphic demonstration of selected components in the report. Many might think that Conditions work similar to Filtration, but that is not the case. Despite the fact that both instruments select necessary components from the total amount of information by specified conditions, the final result is much different. After using Filtration in the report only those data that fit the criteria for selection are output. The remaining data rows are not displayed at all. In the case of Conditions, data rows remain in a report, but their appearance is changed, without modifying the functional purpose of the report. Conditions is a higher-level tool than Filtration, because Filtration can only reduce the number of printed data rows. The main purpose of Conditions is formatting but this tool also provides the ability to filter data. Let’s consider some of the features of Conditions. For example we need to summarize by the year, quarter, month, etc. For visualization, you can select positive values of totals in green and negative in red. This can be done using Conditions.
The Conditions property have all components, pages and bands. But keep in mind that the Conditions property is not available for the Report, because it cannot be disabled and has no visual design options. Conditions is divided into the following types: Highlight Condition, Data Bar Condition, Color Scale Condition and Icon Set Condition.
Each of these types has its own distinctive features: Highlight Condition is used to set the font and background style; Data Bar Condition is used for graphical dynamic changing of values; Color Scale Condition is used for selecting a component color, which varies from a minimum value to a maximum one; Icon Set Condition is used to mark a component with an icon, on which the condition is covered. All of the above conditions are working with components placed on the band, besides the Highlight Condition which can work not only with the component but also directly with the band.
Where Can We Find And How to Use This?
To use the Conditions, you must know where it is located. The most logical way resulting from the name "Conditions property" is the properties panel on the right side of the screen. For example, for a text component as well as for a DataBand, the Conditions property is located in the Appearance tab on the properties panel.
Also, the window of the Conditions property can be invoked by clicking the Conditions on the control panel. The exact location of this button depends on the type of UI. When using Standard UI, the Conditions button is in the end of the Formatting toolbar.
When using the Ribbon 2007 UI, Conditions can be found on the Home tab, in the Styles group.
In Ribbon 2010 UI, Conditions is also located as in the Ribbon 2007 UI - on the Home tab, in the Styles group.
Sorted out with location. Then, when you click the corresponding button, in the Conditions Editor box, select the desired options and set parameters.
Several buttons can be found in the Condition dialog box:
1) Add Condition. This button adds a new condition to the list of conditions for the selected component. For each component it is possible to create one, two, three, four and more conditions. There are no restrictions in this way.
2) Remove Condition. Removes the previously selected condition from the list of conditions of a component.
3) Buttons which are used to change the order of conditions.
This article is the first one which covers the features of Conditions. In the next article, we will review Highlight Condition.