We are excited to announce the release of the latest version of Stimulsoft products for creating reports, dashboards, and forms - 2024.2! In this update, you will find products for Python applications and services, a new dashboard element, compatibility of our components with .NET 8.0, enhanced functionality for interactivity in dashboards, and much more.


A list of the new features in version 2024.2
Reporting tool for Python
We are pleased to introduce a new product - Stimulsoft Reports.PYTHON! This is a set of libraries that you may use for creating, viewing, exporting, and printing reports in applications and projects written in Python. The product is based on client-server technology: a Python application on the server side and a JavaScript reporting engine on the client side.Dashboards for Python
We are also pleased to announce the launch of Stimulsoft Dashboards.PYTHON - a product for data visualization in the context of creating analytical panels in Python applications and services. The product consists of a JavaScript data processing engine, a designer for creating dashboards, and a viewer for viewing them. These components are closely related to each other and represent full-fledged tools for working with dashboards in web applications built with Python.The New Element - Web Content
In this release, we have added a new dashboard element - Web Content. You can use it to display any content via a link or an embed code. This functionality allows you to add videos, website pages, and other embed codes to dashboards.Components for .NET 8
Another important update! Starting with version 2024.2.1, .NET 8 support has been added for our components. Our libraries will now be compiled using the .NET 8.0 SDK. We closely monitor the development of .NET and strive to ensure that our components are compatible with the latest technologies as closely as possible.Parameters in element filters
We have included the capability to transmit parameters while applying filters (the Apply Filter action) in dashboard elements. These parameters can hold filter values. So, when accessing a parameter by its name in a report variable or another dashboard element, it will be possible to retrieve the value of the element's filters.Interaction for dashboard elements
Support for interaction has been added for the List Box, Combo Box, and Shape dashboard elements. Now, you can display a hover tooltip on hovering. However, the click action varies. Clicking on the values in the filtering elements allows you to apply a filter and pass parameters. For Shapes, you can open a hyperlink or another dashboard. The interaction is configured in the same way as for other dashboard elements, within the Interaction editor of the element.Settings for labels in charts
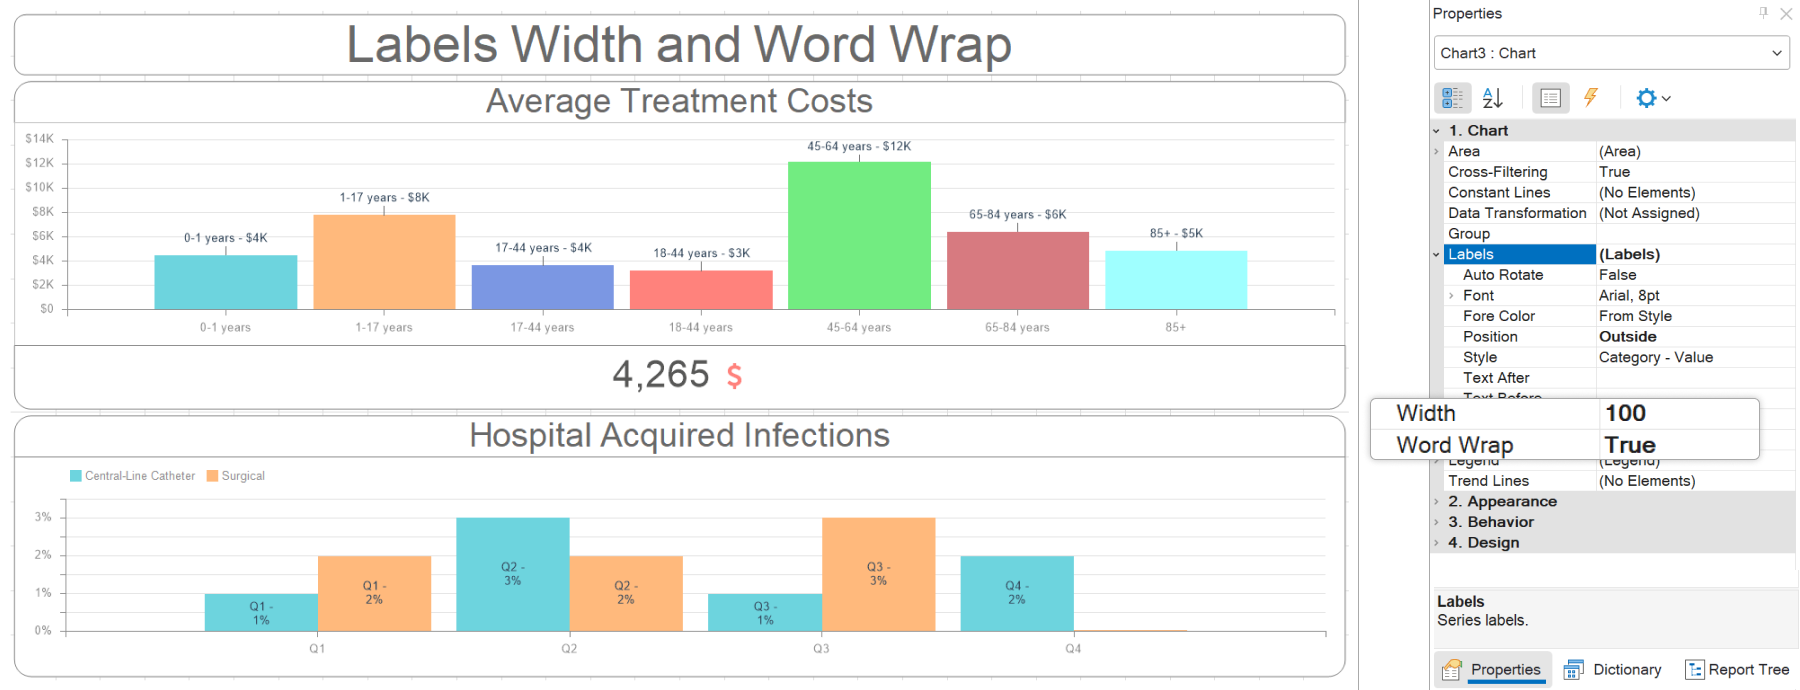
In this release, we have added the ability to set the width in pixels for labels in dashboard charts. This can be accomplished using the Width property in the Labels group. By default, the property is set to 0, which means that the width of the labels is calculated automatically. Additionally, we have introduced the ability to enable line wrap mode for labels by setting the Word Wrap property from the Labels group to True.
Reset all filters in events
We have introduced the ability to reset all filters when an event occurs in dashboards. If you create an event script using Blockly, you can reset all filters using a separate process called Reset All Filters. If you write an event script using code, a special method has been added. In C#, this method is InvokeResetAllFilters(), and in JavaScript, it is invokeResetAllFilters().New functions
New functions for checking data for a report or dashboard have been added to the Data category. You can use the IsNumeric() function to check whether a value is numeric. The IsDataEmpty() function checks whether a data source contains at least one row of data. When using the IsAllDataRowNullOrEmpty() function, you can check whether all rows in a data column are empty or null. Also, the IsNullOrEmpty() and IsNullOrWhiteSpace() functions have been added, which are used to check whether a value is null, empty, or a whitespace.Aligning values in parameters
In version 2024.2.1, you can change the alignment of values in parameters when viewing reports and dashboards. By default, all parameter values are left-aligned. However, using the Parameter Alignment property, you can set the location of values in the parameter field to Left, Center, or Right.The new style
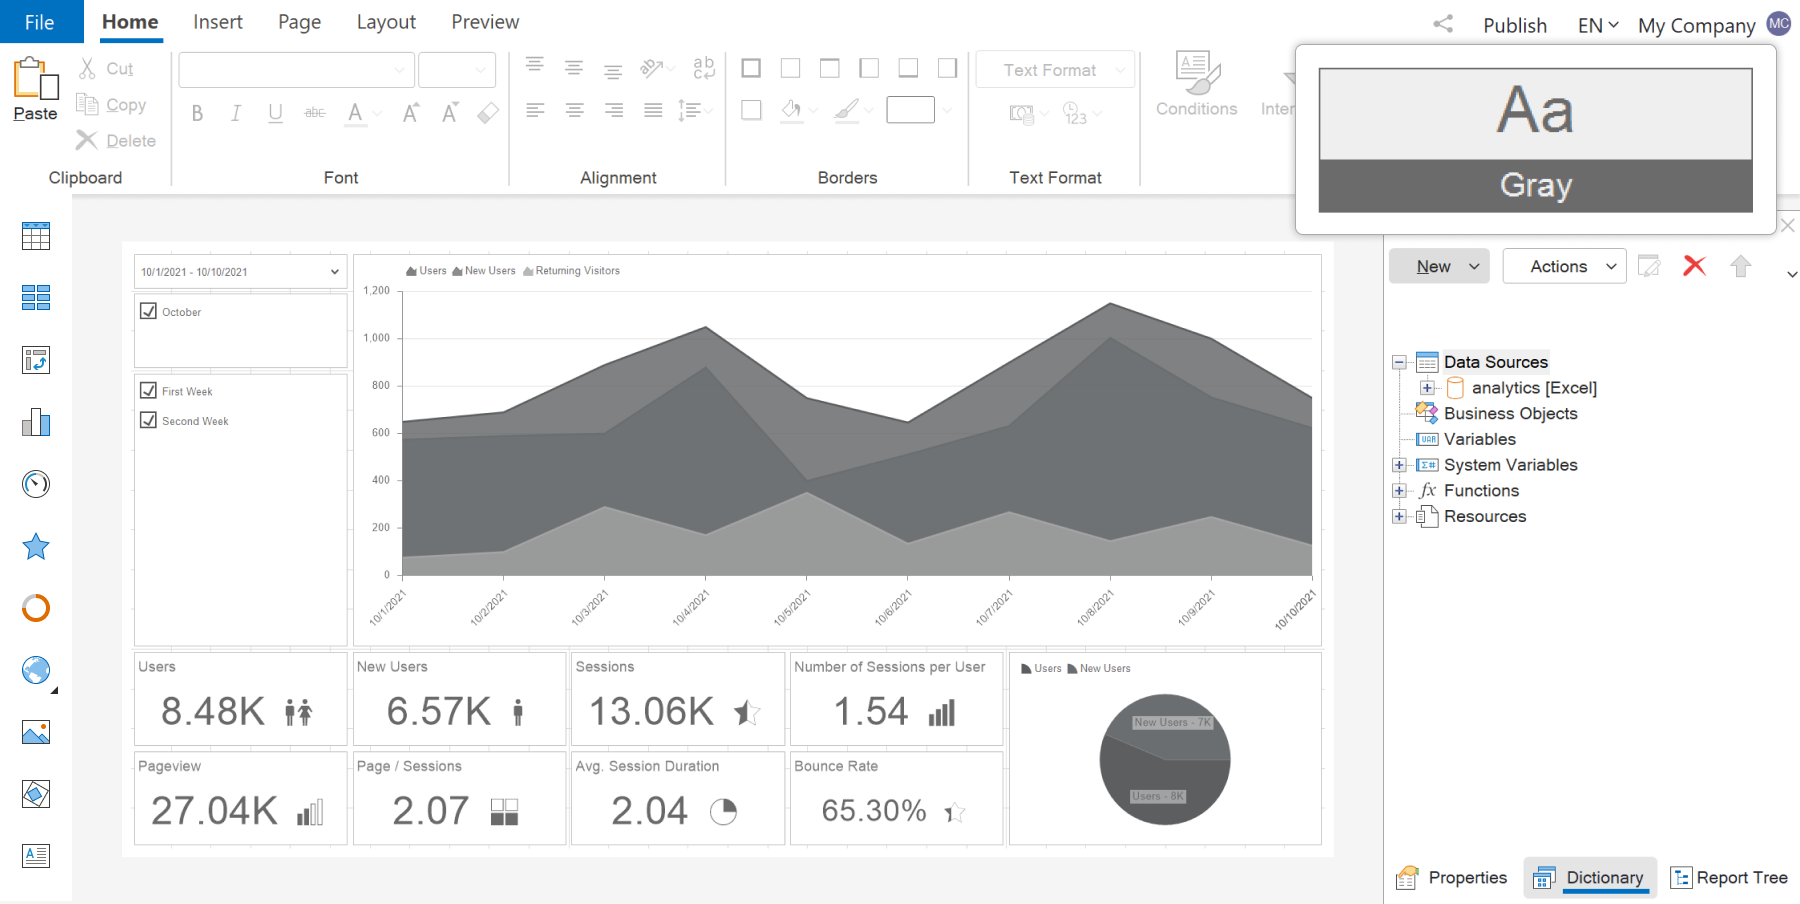
We have added a new design style for the dashboard and its elements - Gray, as well as a new preset style for report components - Style36. To apply the new style, select the dashboard and choose the Gray theme from the Style menu.