Hello dear users of Stimulsoft reporting tools! We are always glad to share you the latest news about our product and various novelties. This time we want to tell you about Text Format.
Text Format
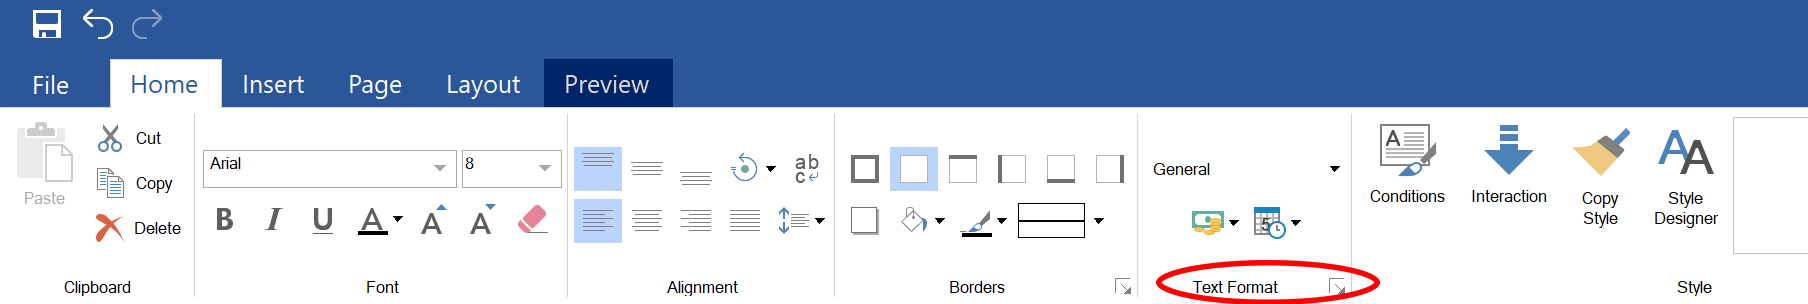
Text Format is a functionality that allows to apply various templates to text. With the help of it you can display your text in different variants, such as money, percents, decimal numbers and phone numbers.All settings of the text format you can find in Home tab in Text Format panel:
There is a set of standard templates, their settings depend on the localization of operating system, and a form call-button of Text Format in the Text Format panel:
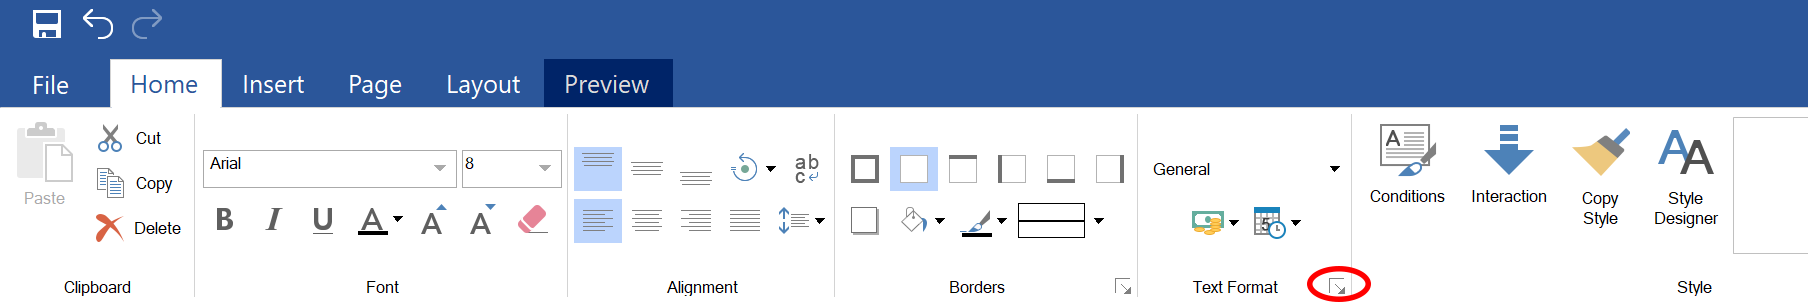
This button allows to set additional format properties:
Currency Format
For example you want to type a dollar symbol "$", but you use a computer with Russian locale and you have to send a financial report to your colleagues in the USA, using symbol "$". Also you want to type percentages and decimal numbers in this report.To do it you should choose Currency Format:
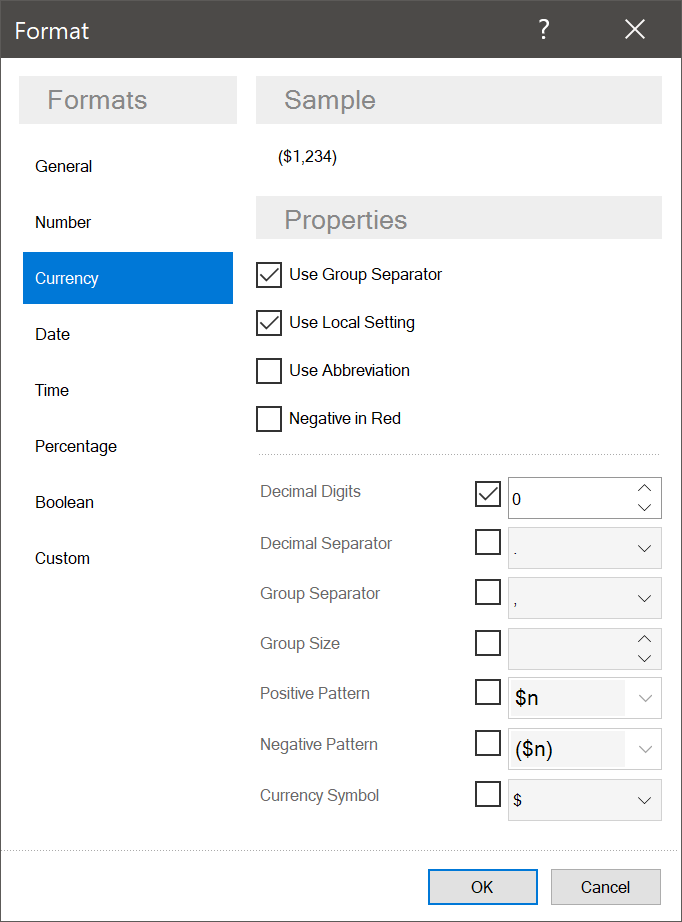
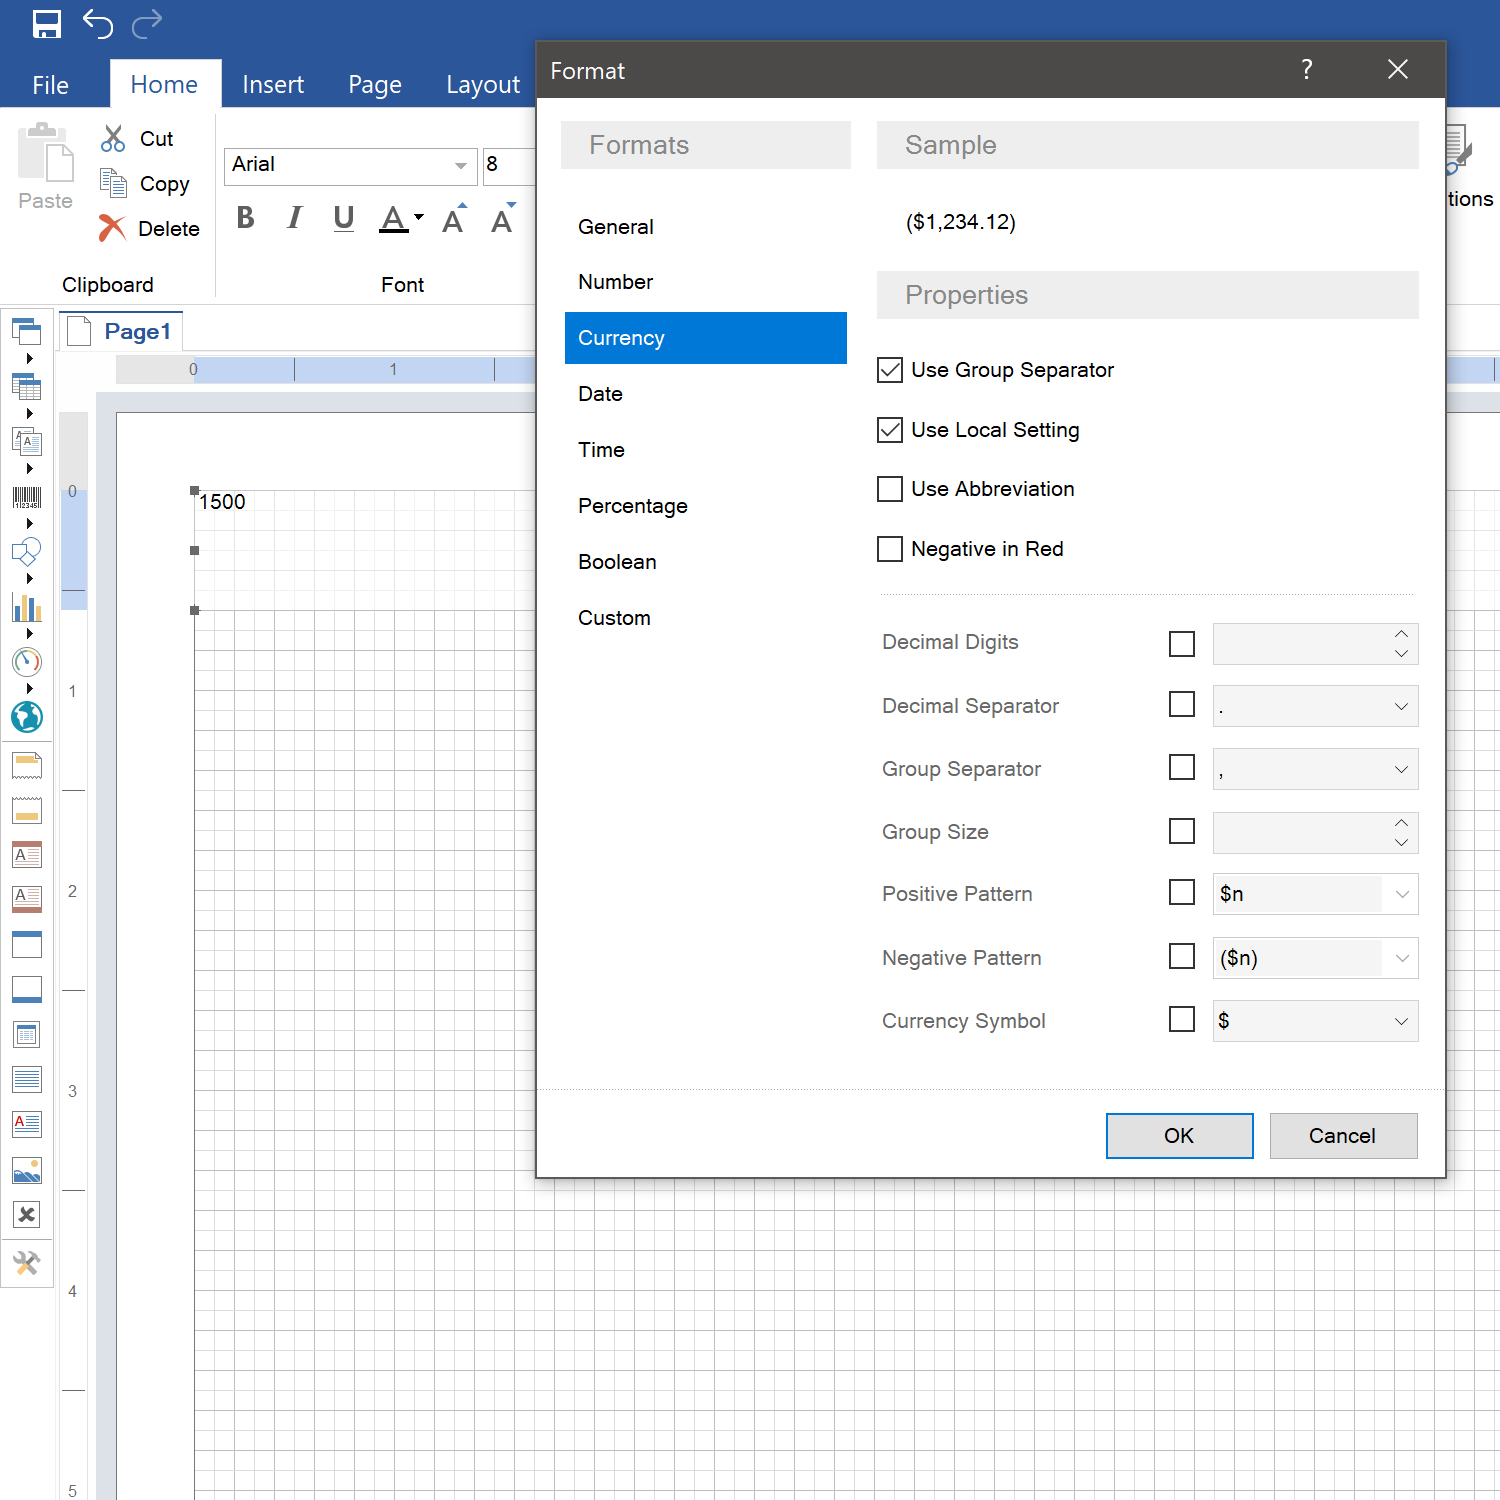
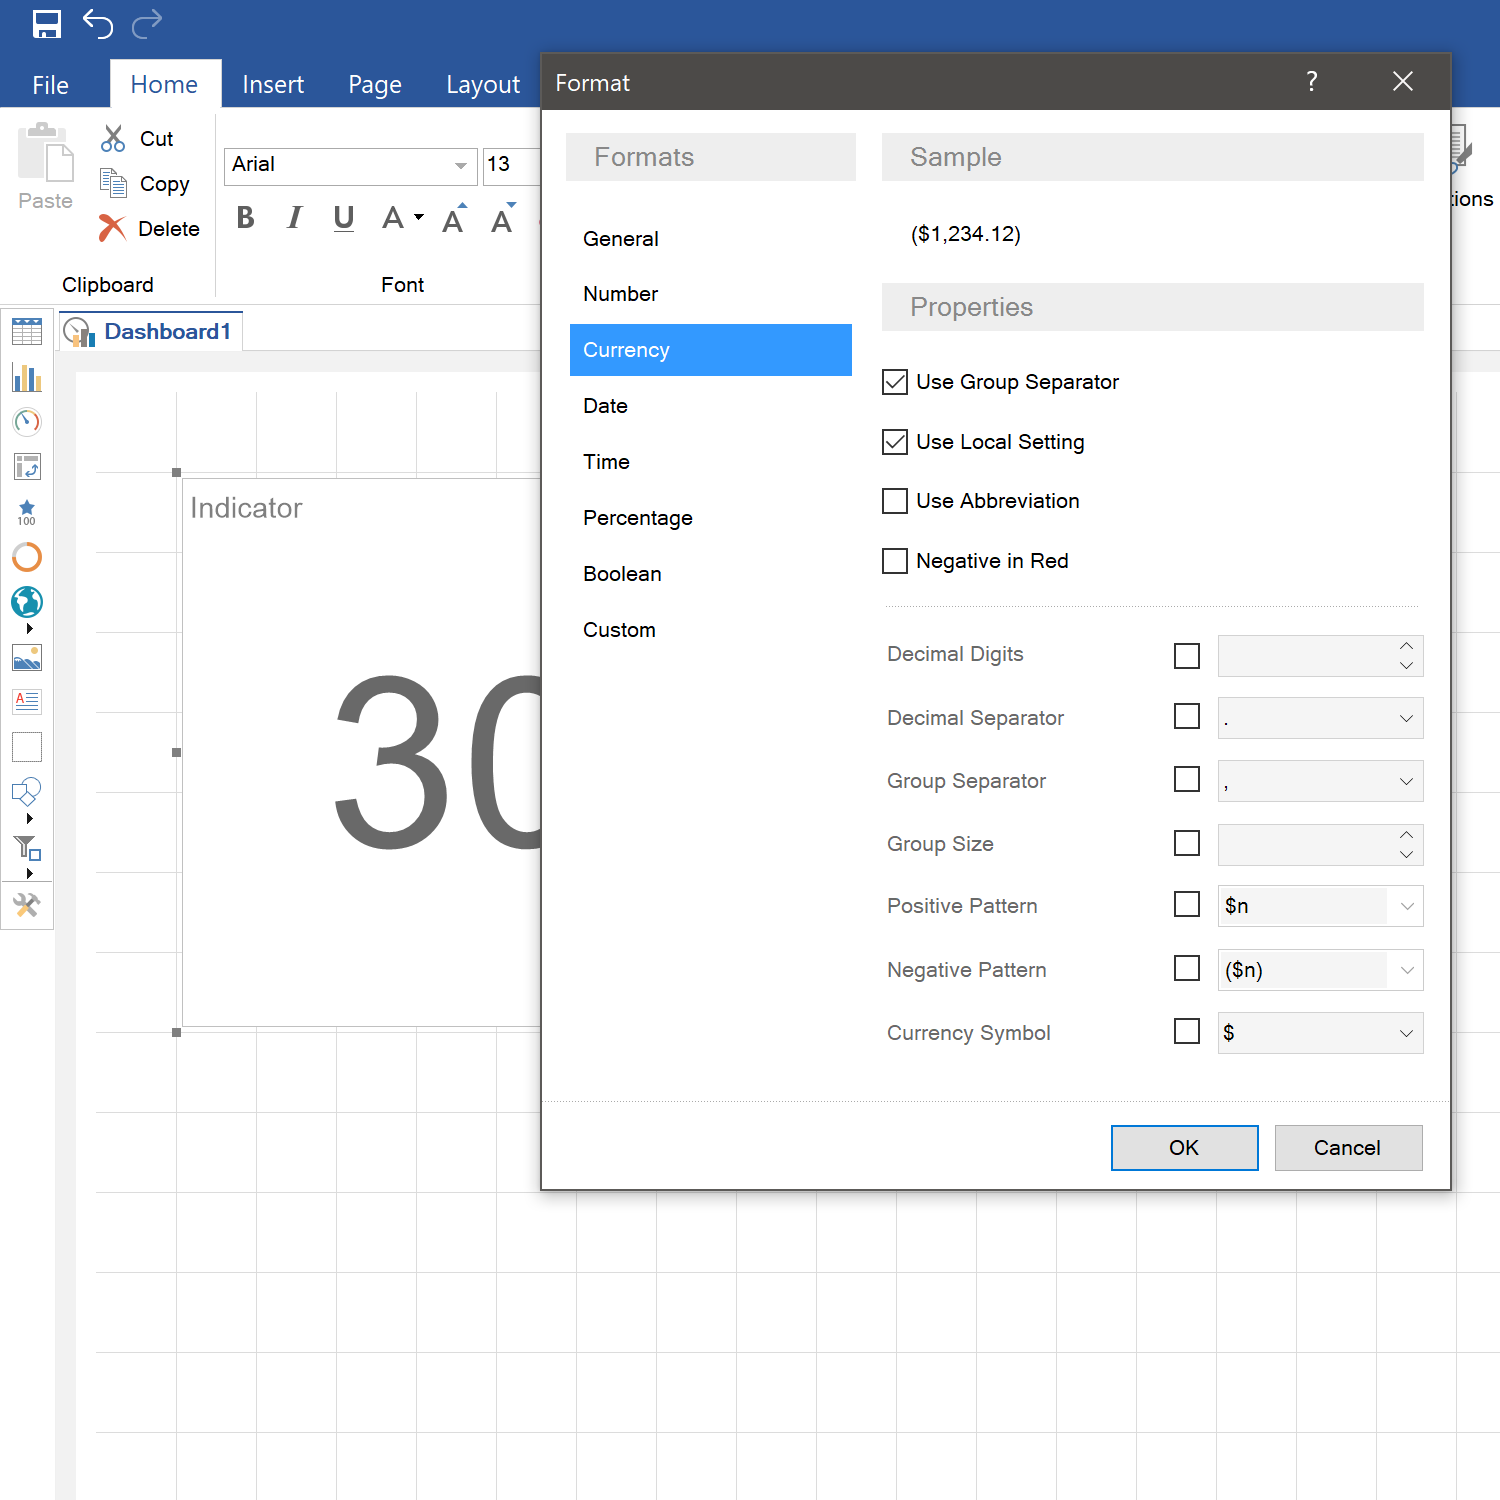
This format is applied to text, if you need to use currency designation. With the help of this format you can type currency symbol, in your case it`s a dollar symbol "$". For example you just type "1500" text, highlight the text component and then choose Currency format:
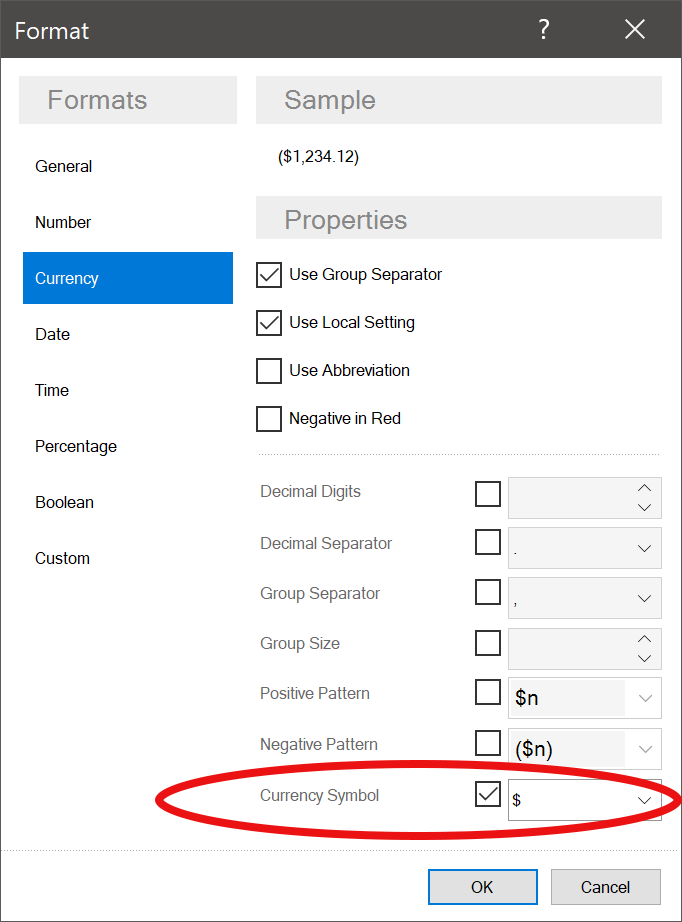
Set the currency symbol you need:
 And you get "$1,500".
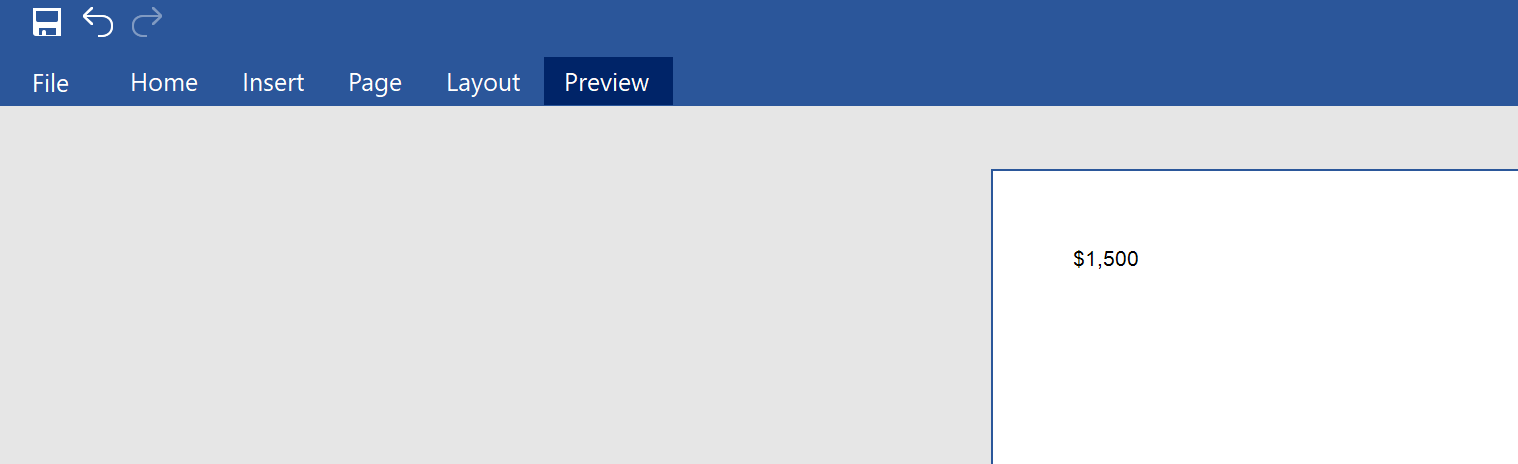
Percentage Format
You can type percentages too. For example you have "87" symbols and you need to turn them into "87%". To do it you should highlight the text component and choose Percentage Format. Remember, that the percentage Format multiplies a value by 100: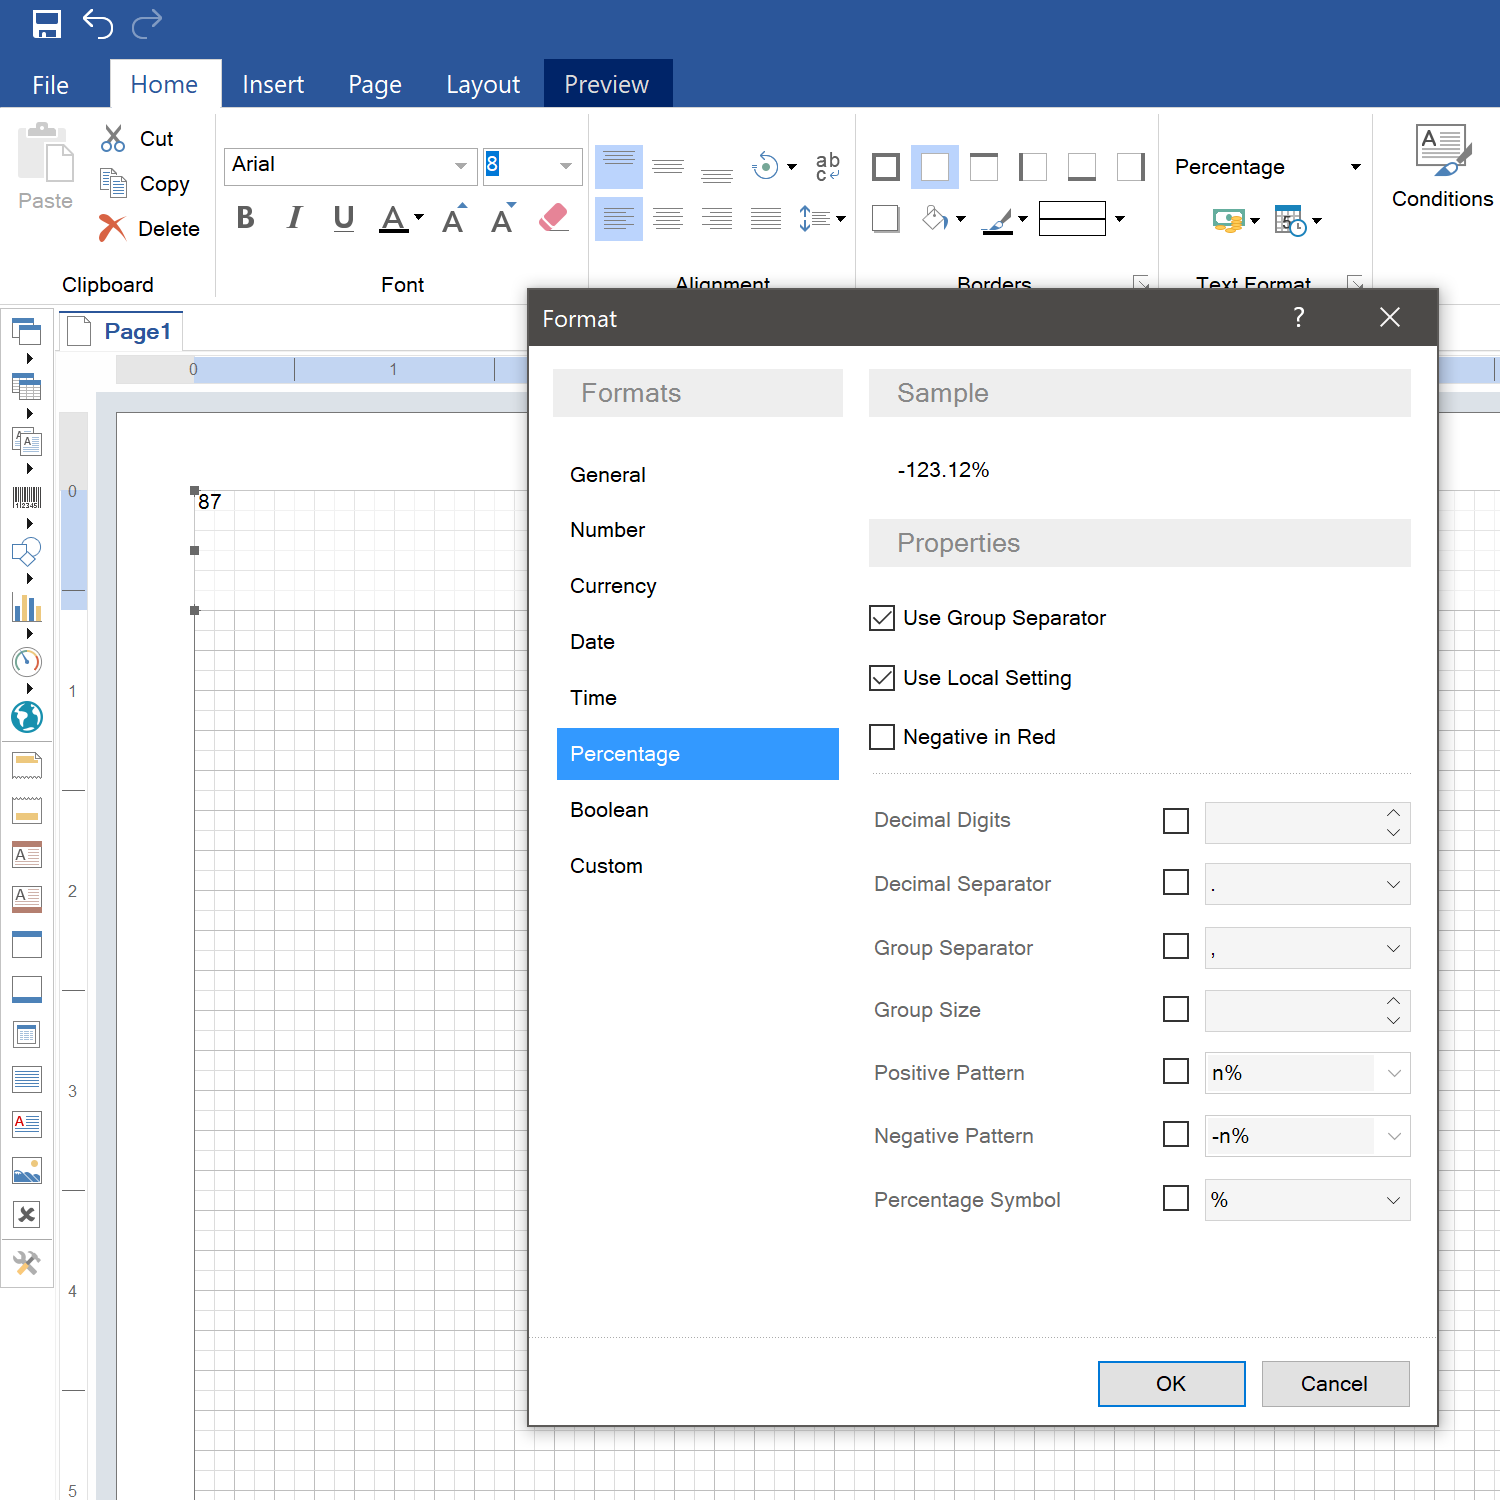
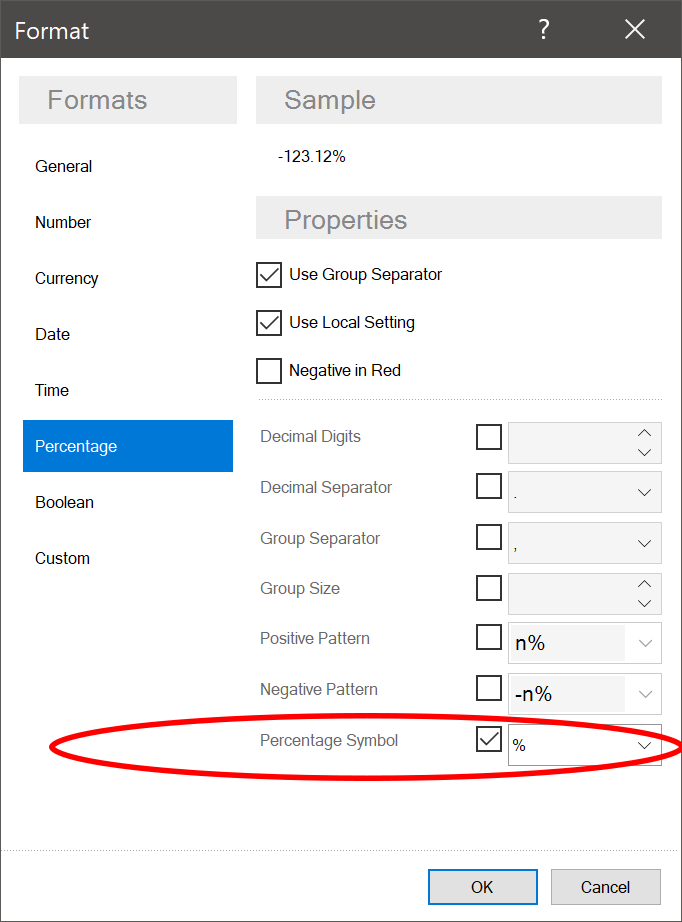
Next, you should set percentage symbol in format properties:
After that you get the result you need.
Number Format
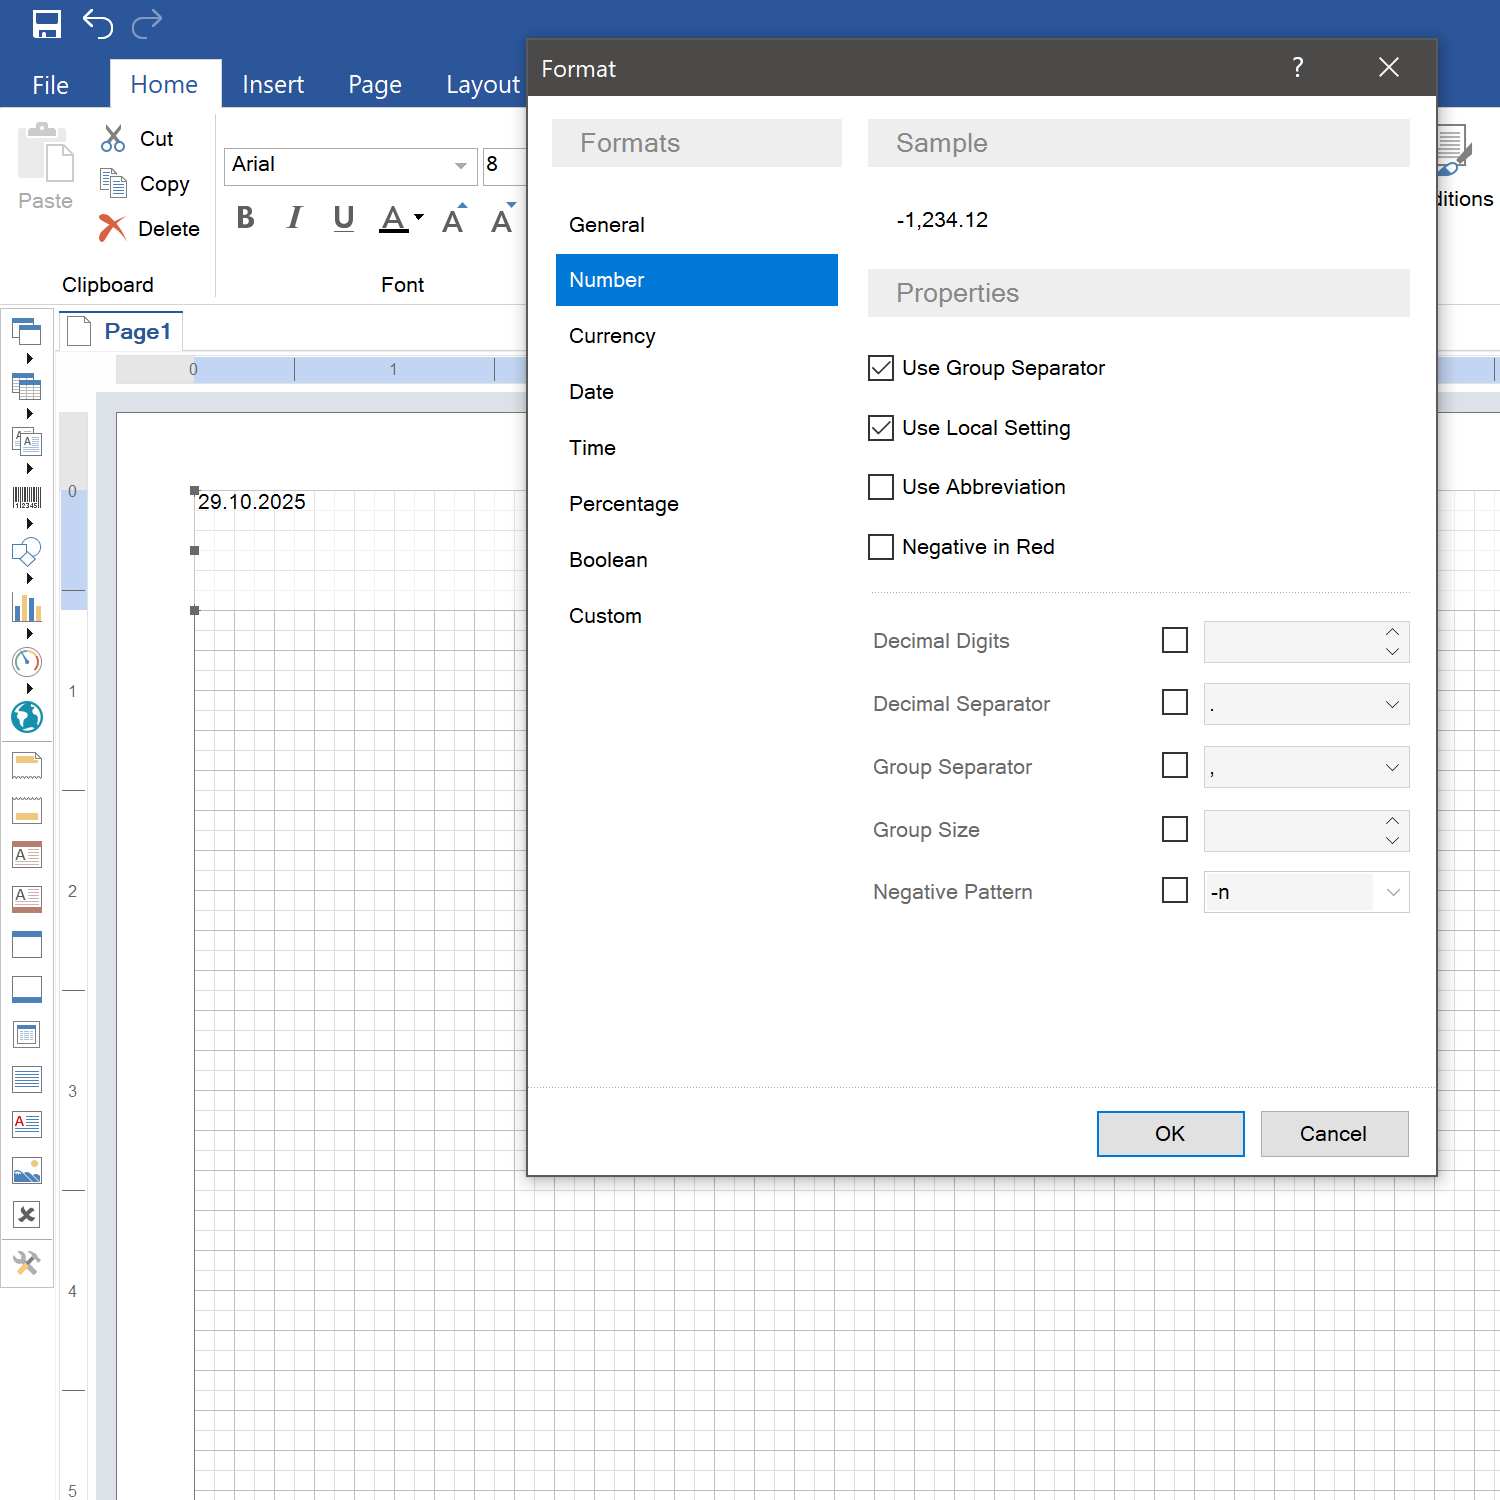
Besides, with the help of Number Format you can change number`s format. For example you need to apply a format with division into groups and adding a fractional part for "1500" text. To do it you should highlight the text component and choose Number Format: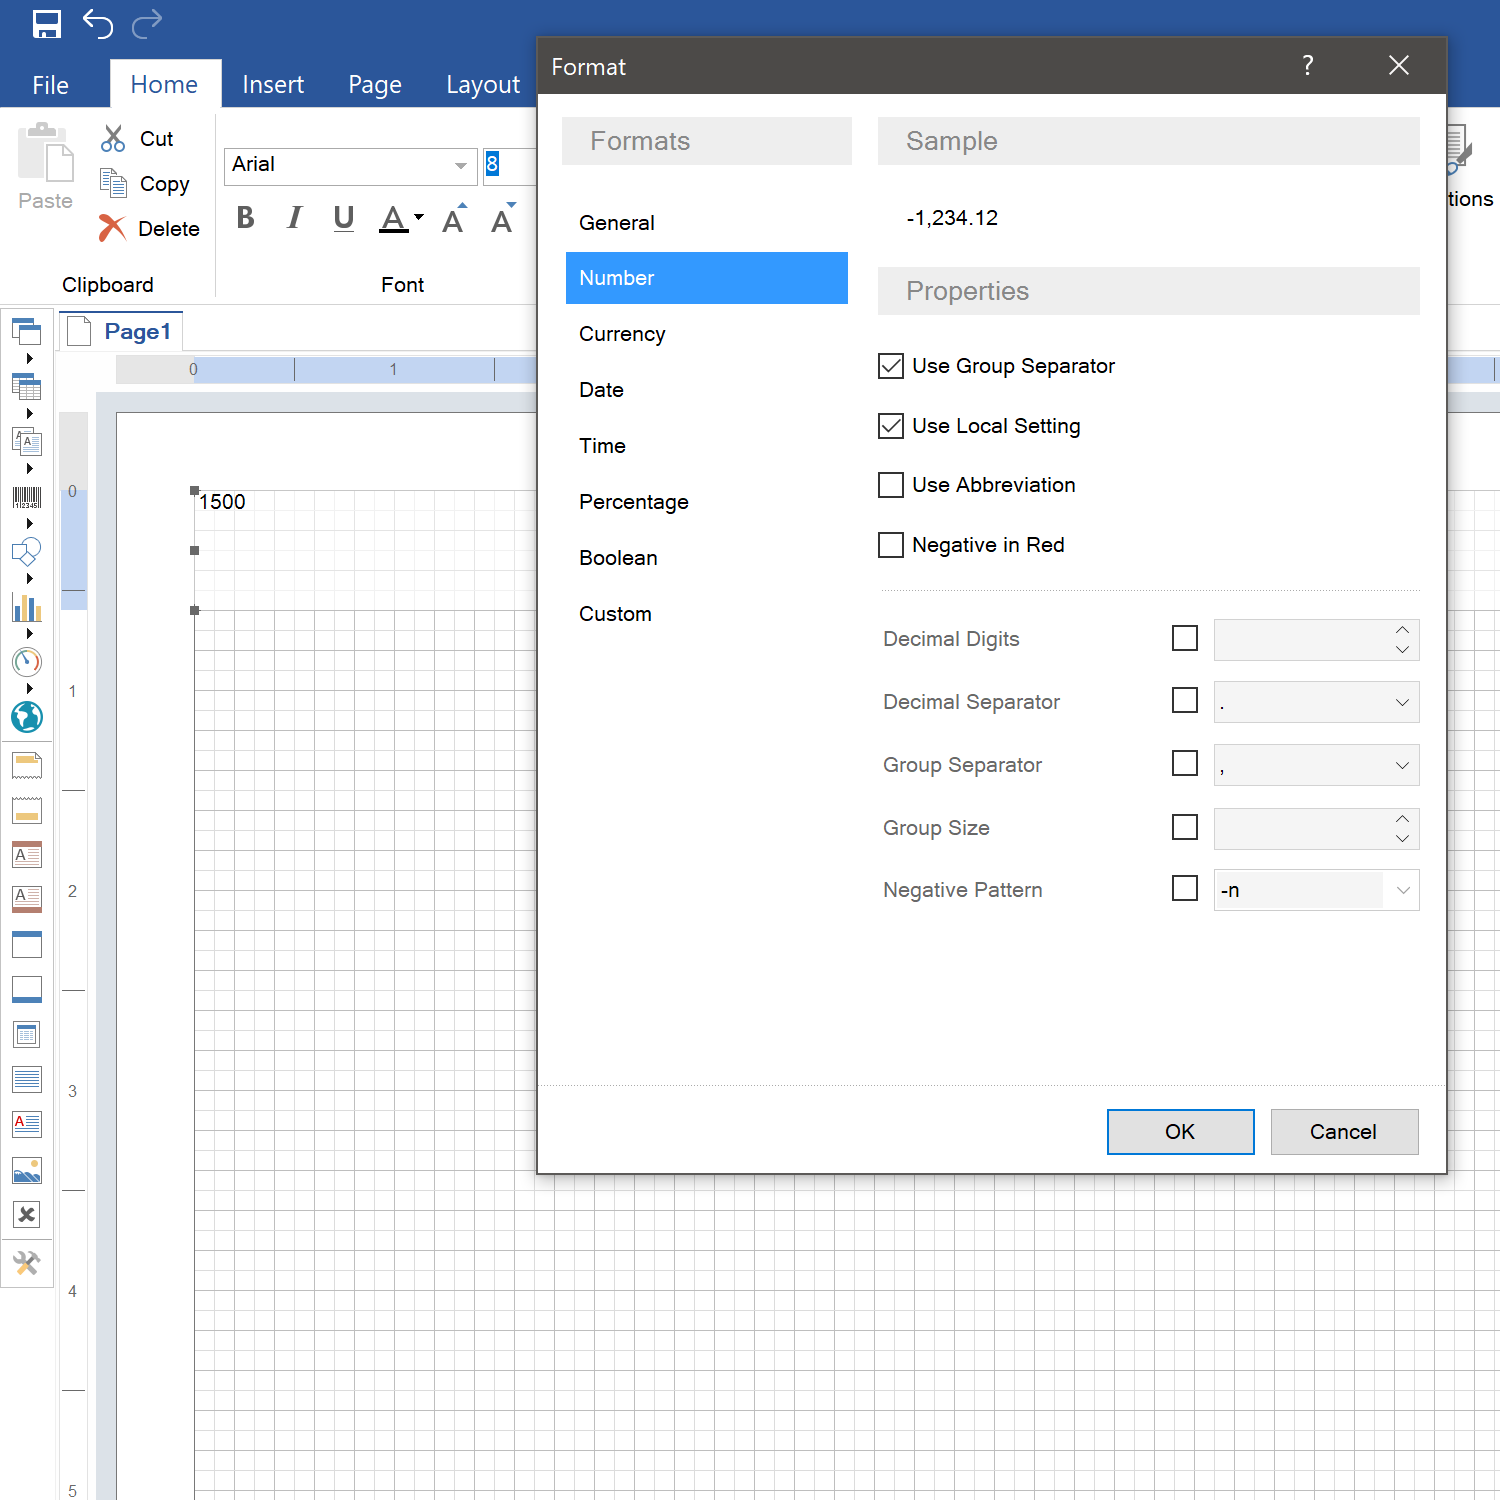
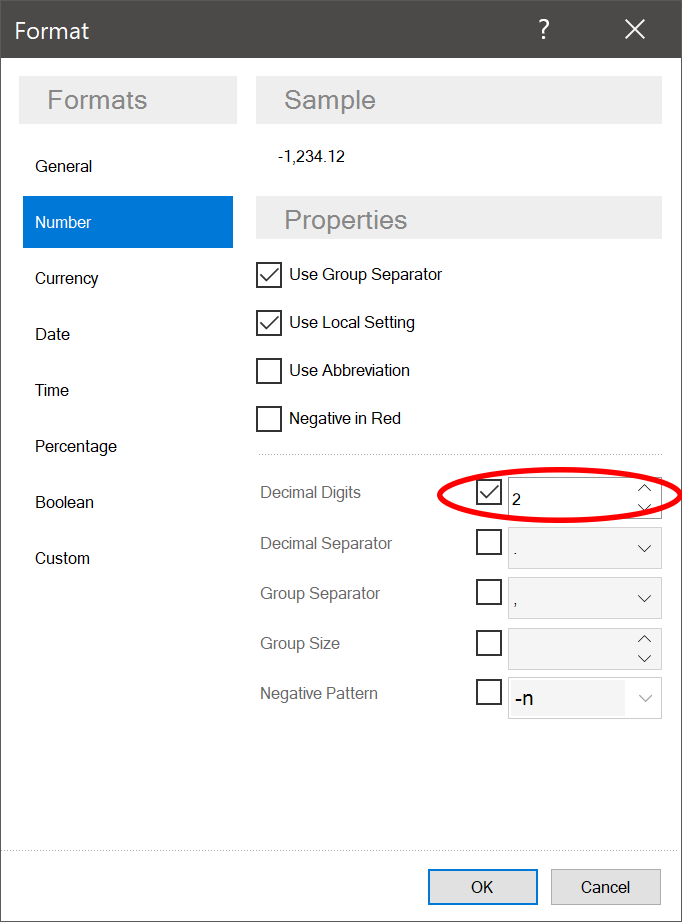
Next, you should set necessary number of fractional signs in format properties:
All of the above formats – Currency, Percentage, Number have the following properties: the number of decimal places, group separator, group size, positive template, negative template and currency template.
Date Format
Also you can change date format. Suppose you have the same situation - you are in Russia, sitting at a computer, where date is put firstly, then month and year and you need to send a report to your colleagues in the USA, where month is put first and only then date and year. To do it you should type in your text the date you are used to, then highlight the text component, choose Date Format and the date format you need: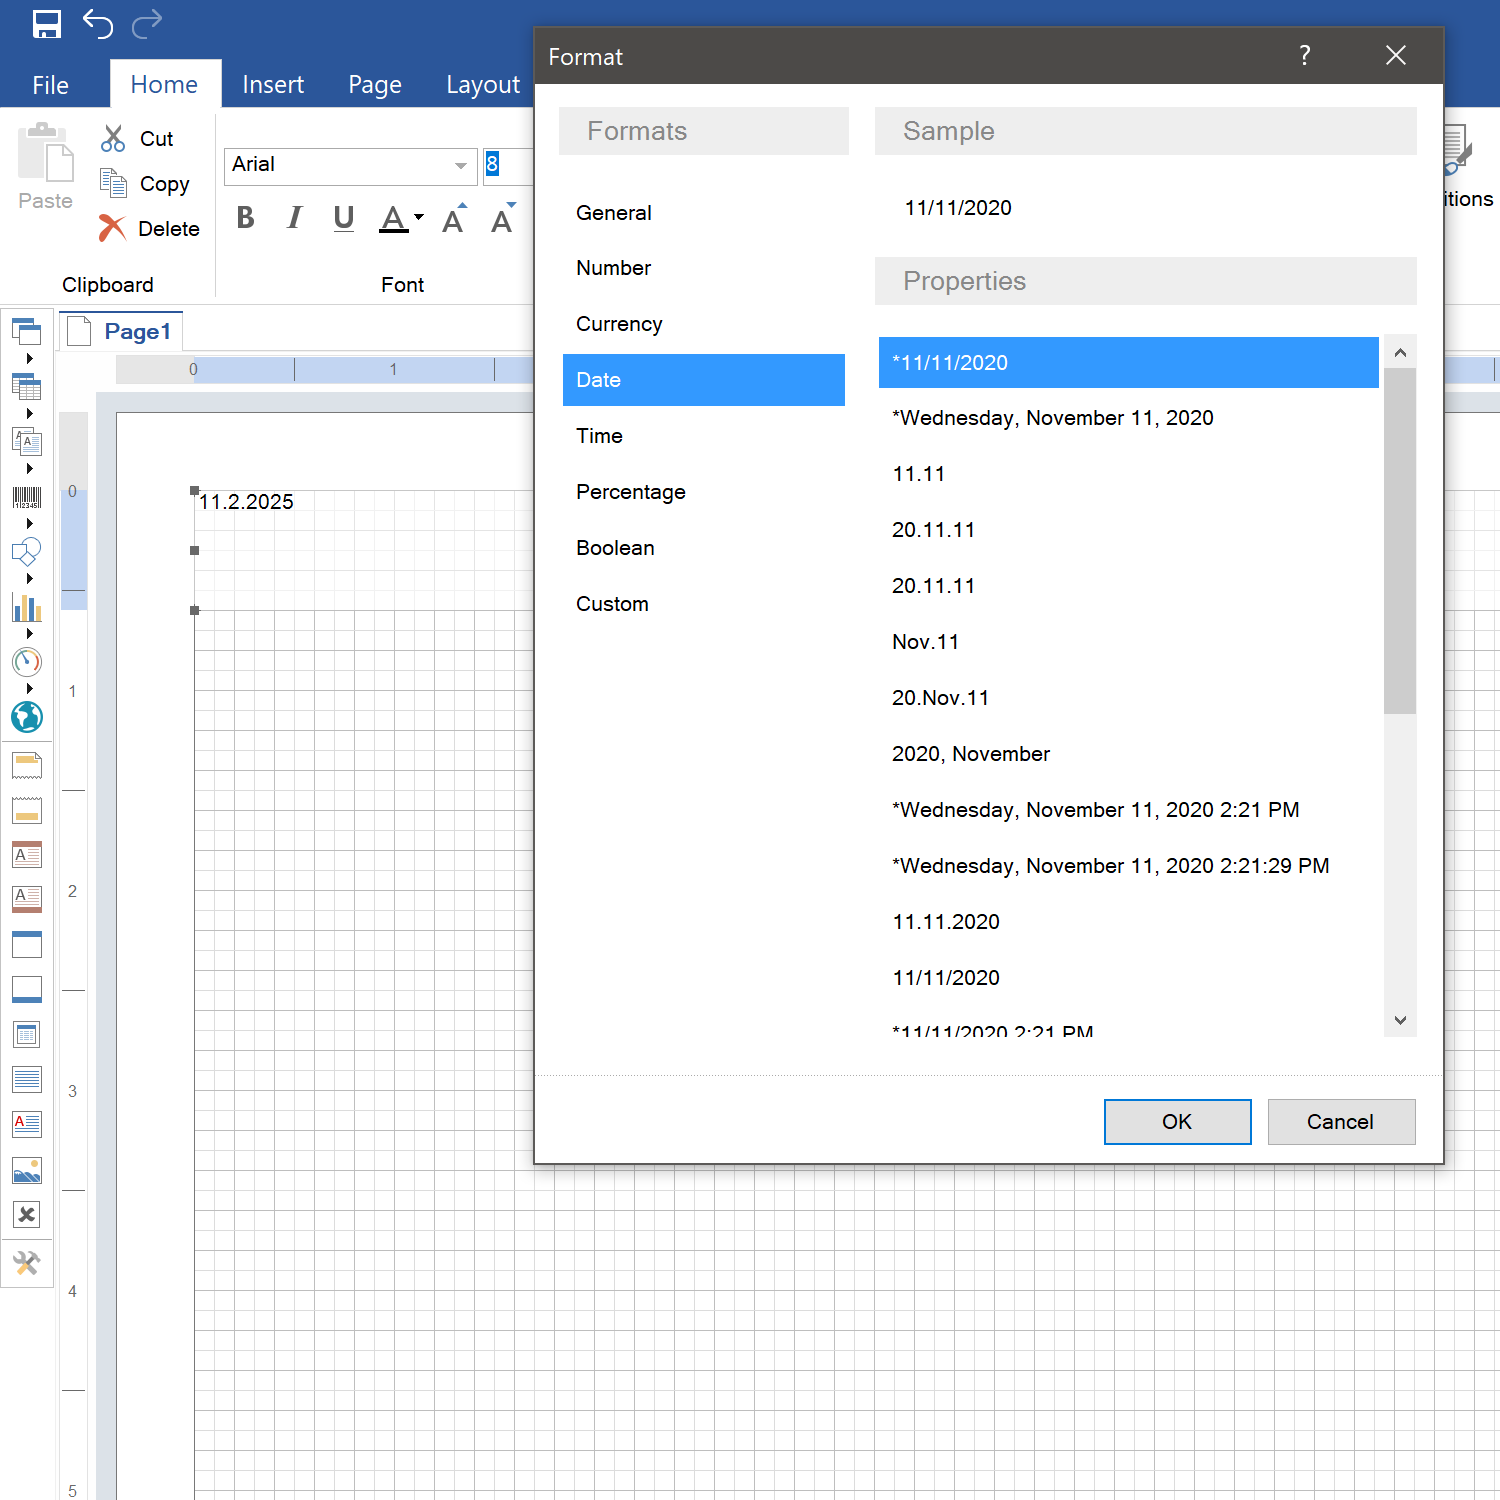
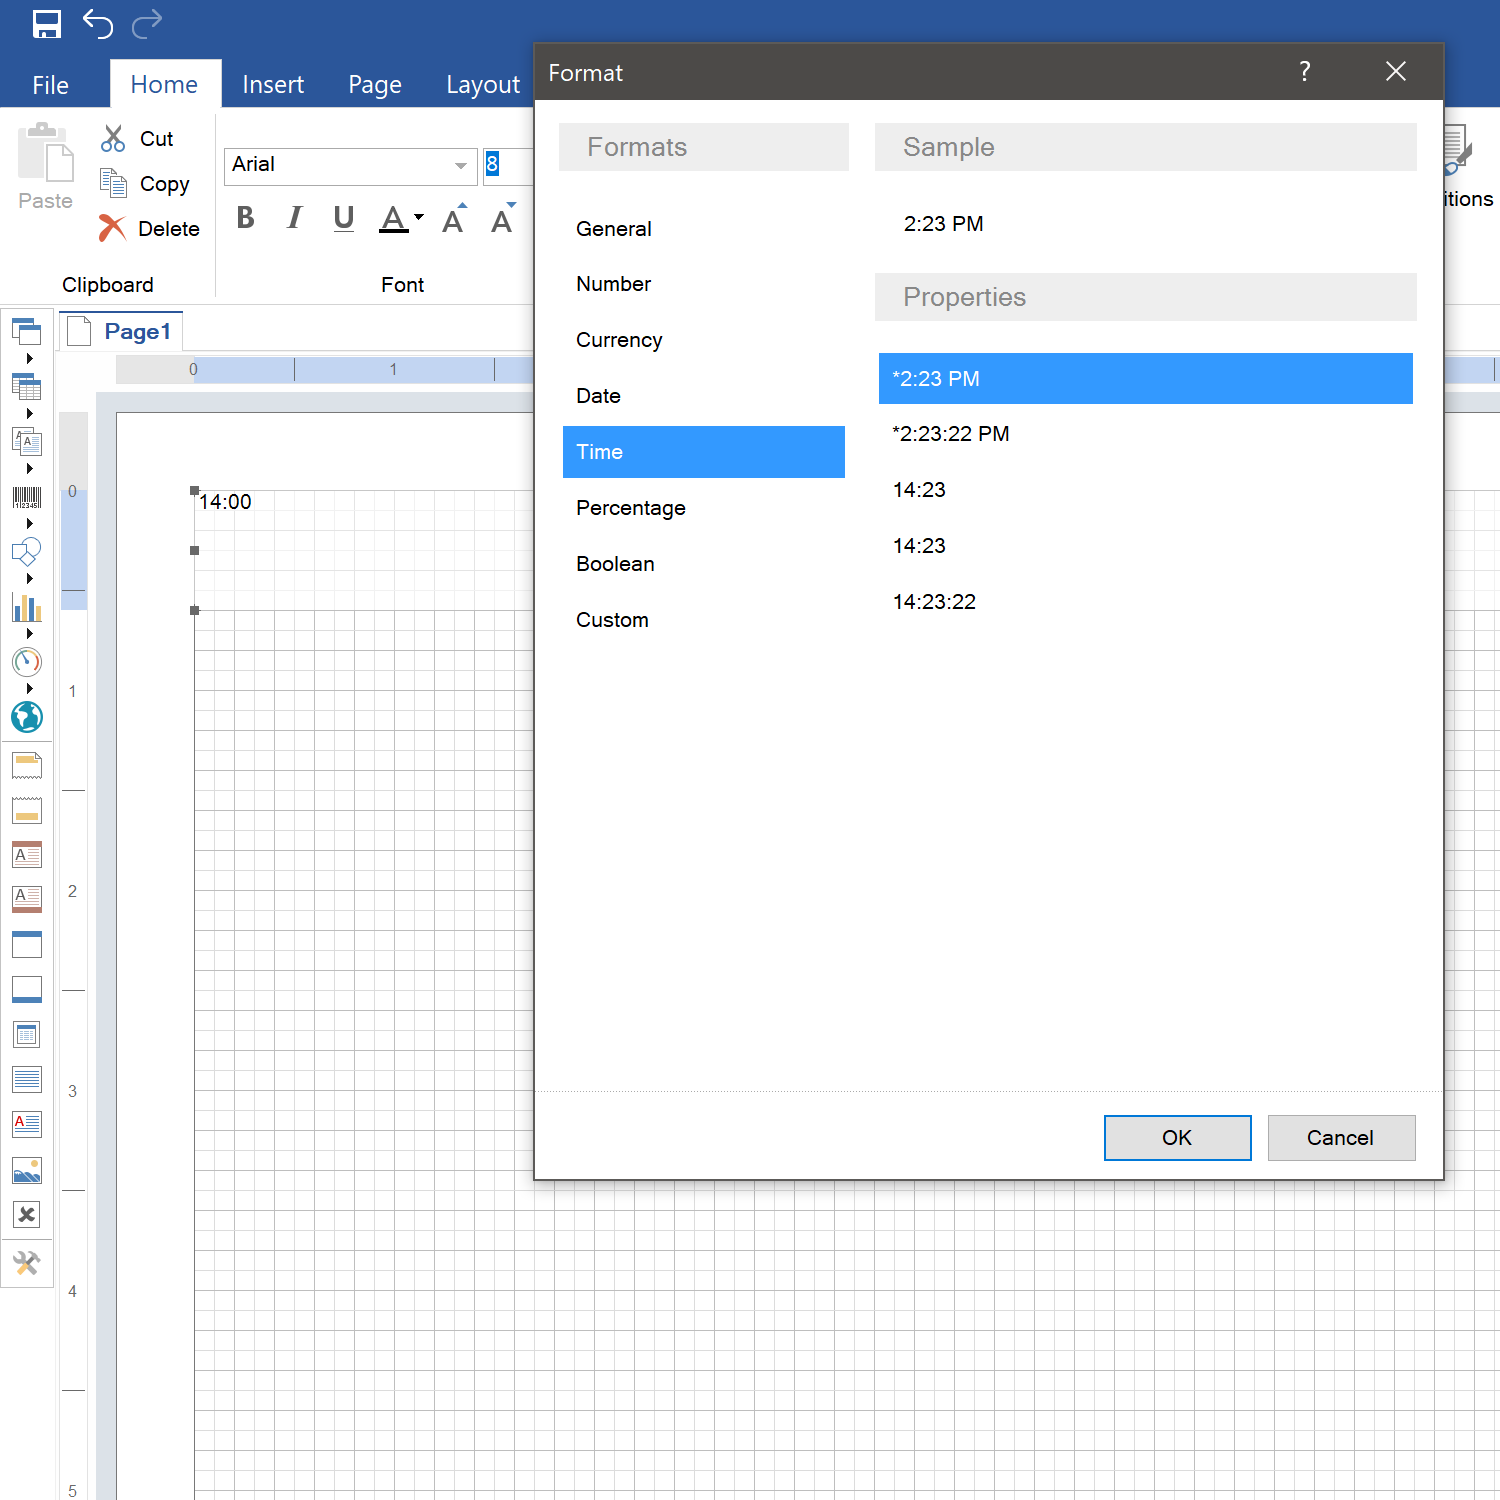
A few more words about changing time format. For example you typed text "14:00", but you decided to change it to "2:00 PM" for your American colleagues. To do this you should highlight the text component, then choose Time Format and P.M. format:
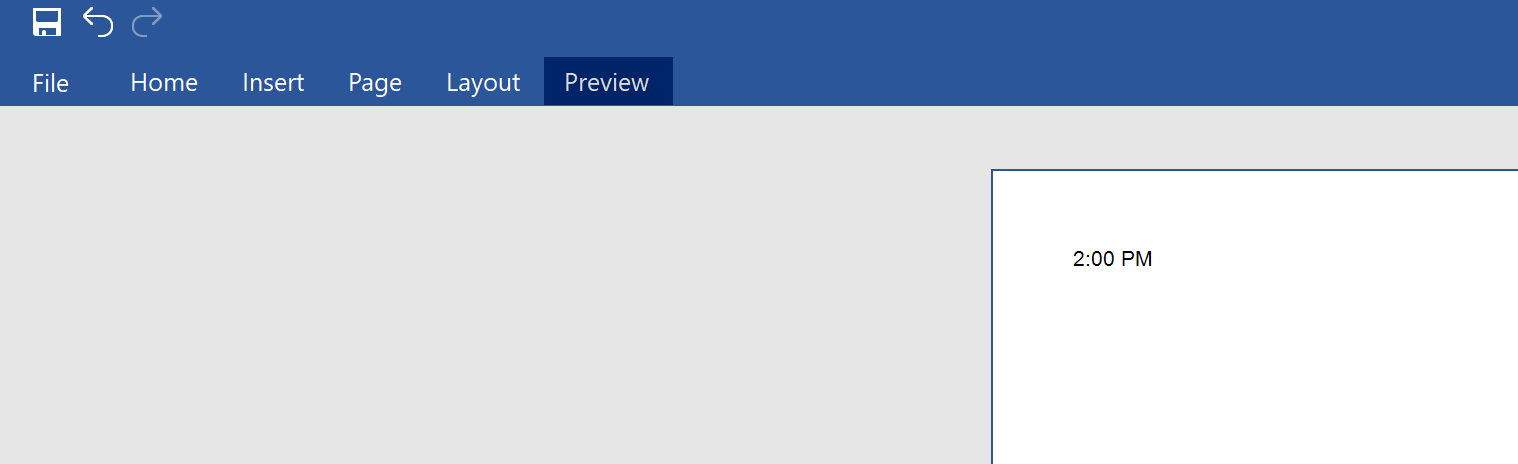
And you get the result you need:
Custom Format
In addition to the above you can format a phone number. For example you need to display a phone number with a code, brackets, dash and so on. To do this you should highlight the text component and choose Custom Format. In this format you can find (###) ### - #### format mask: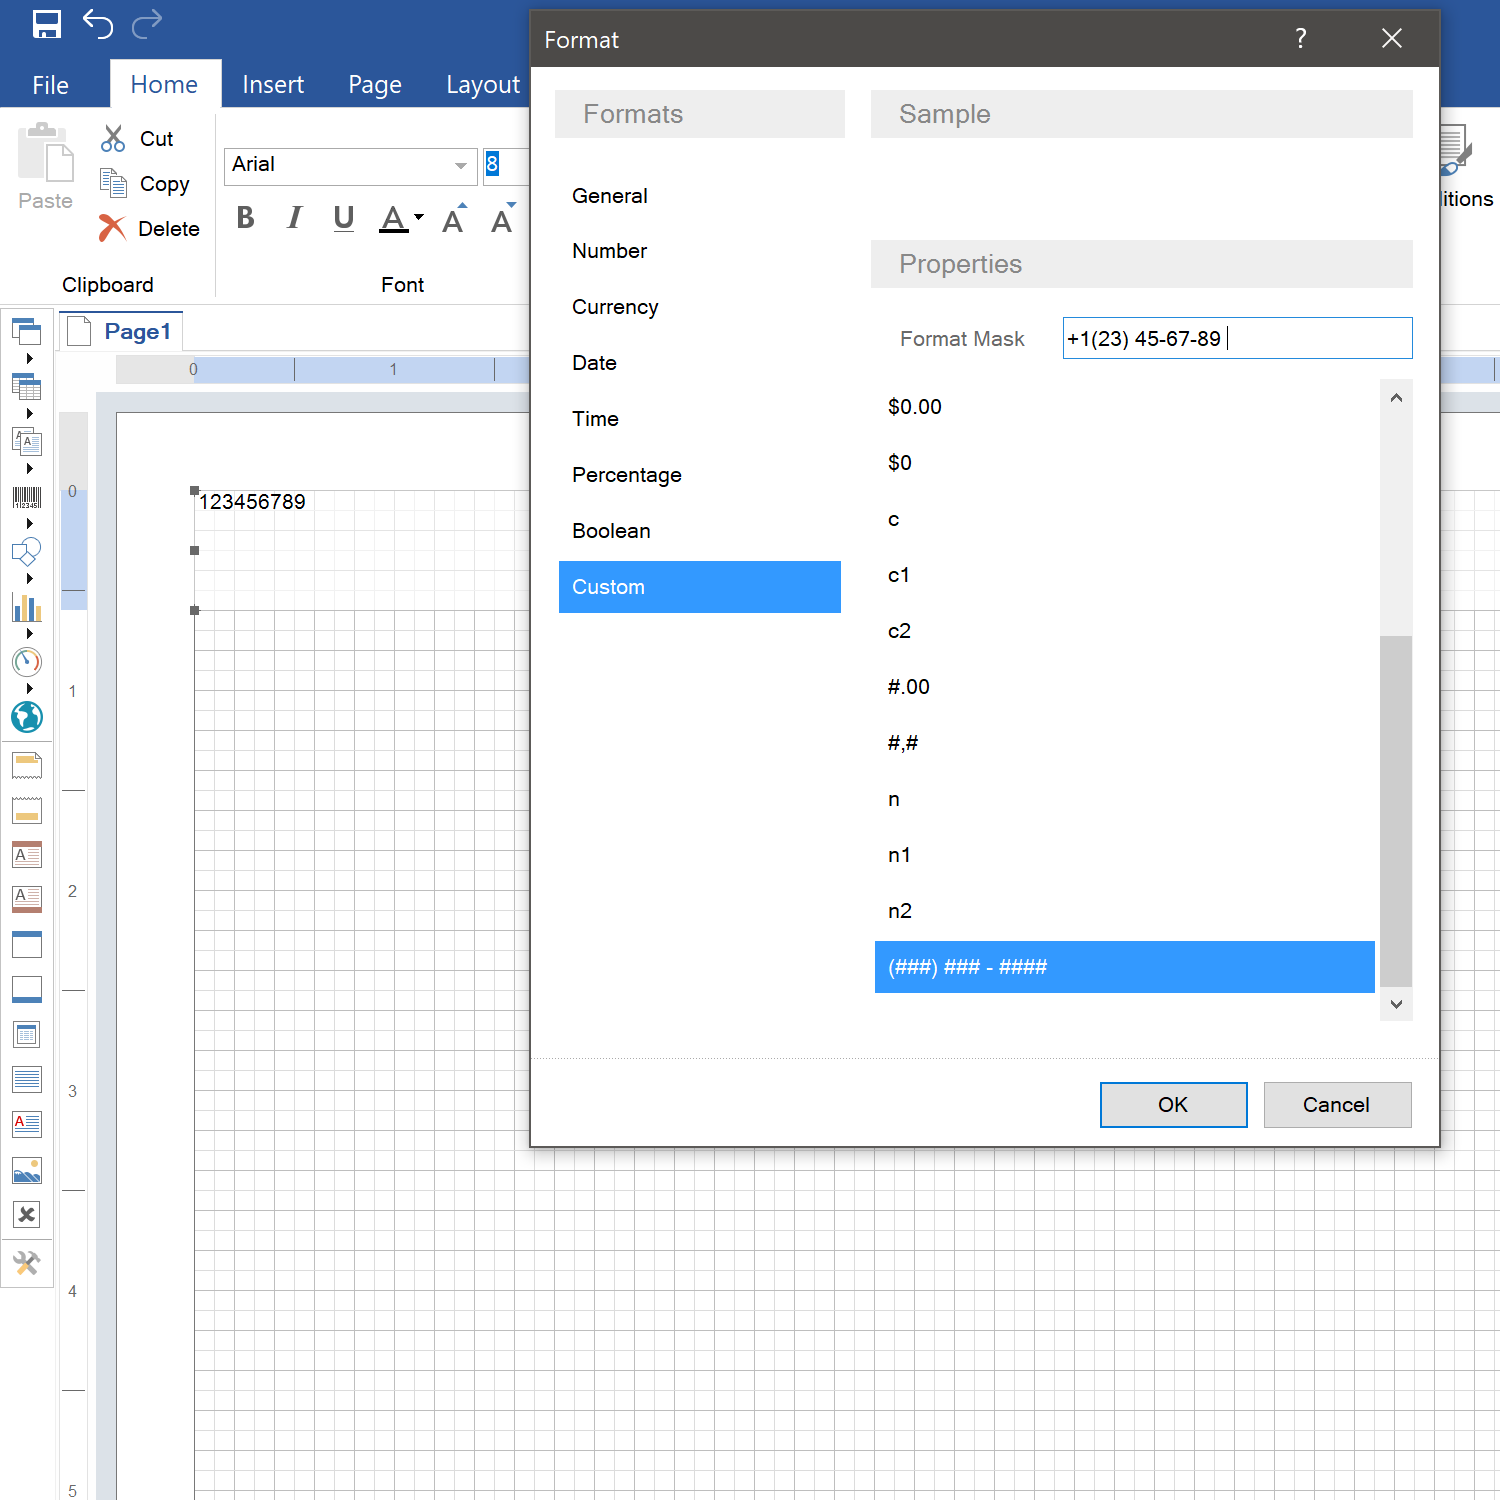
Choose it and you will be able to format a phone number as you need. Next, you should make the template you need: +(##) ## - ## - ##, then the numbers from the text appear instead of hashes and you get "+1 (23) 45 - 67 - 89" from "123456789" text.
Dashboards
It`s worth noting that Text Format can also be applied to many elements in dashboards. For example, indicators and charts.Indicator
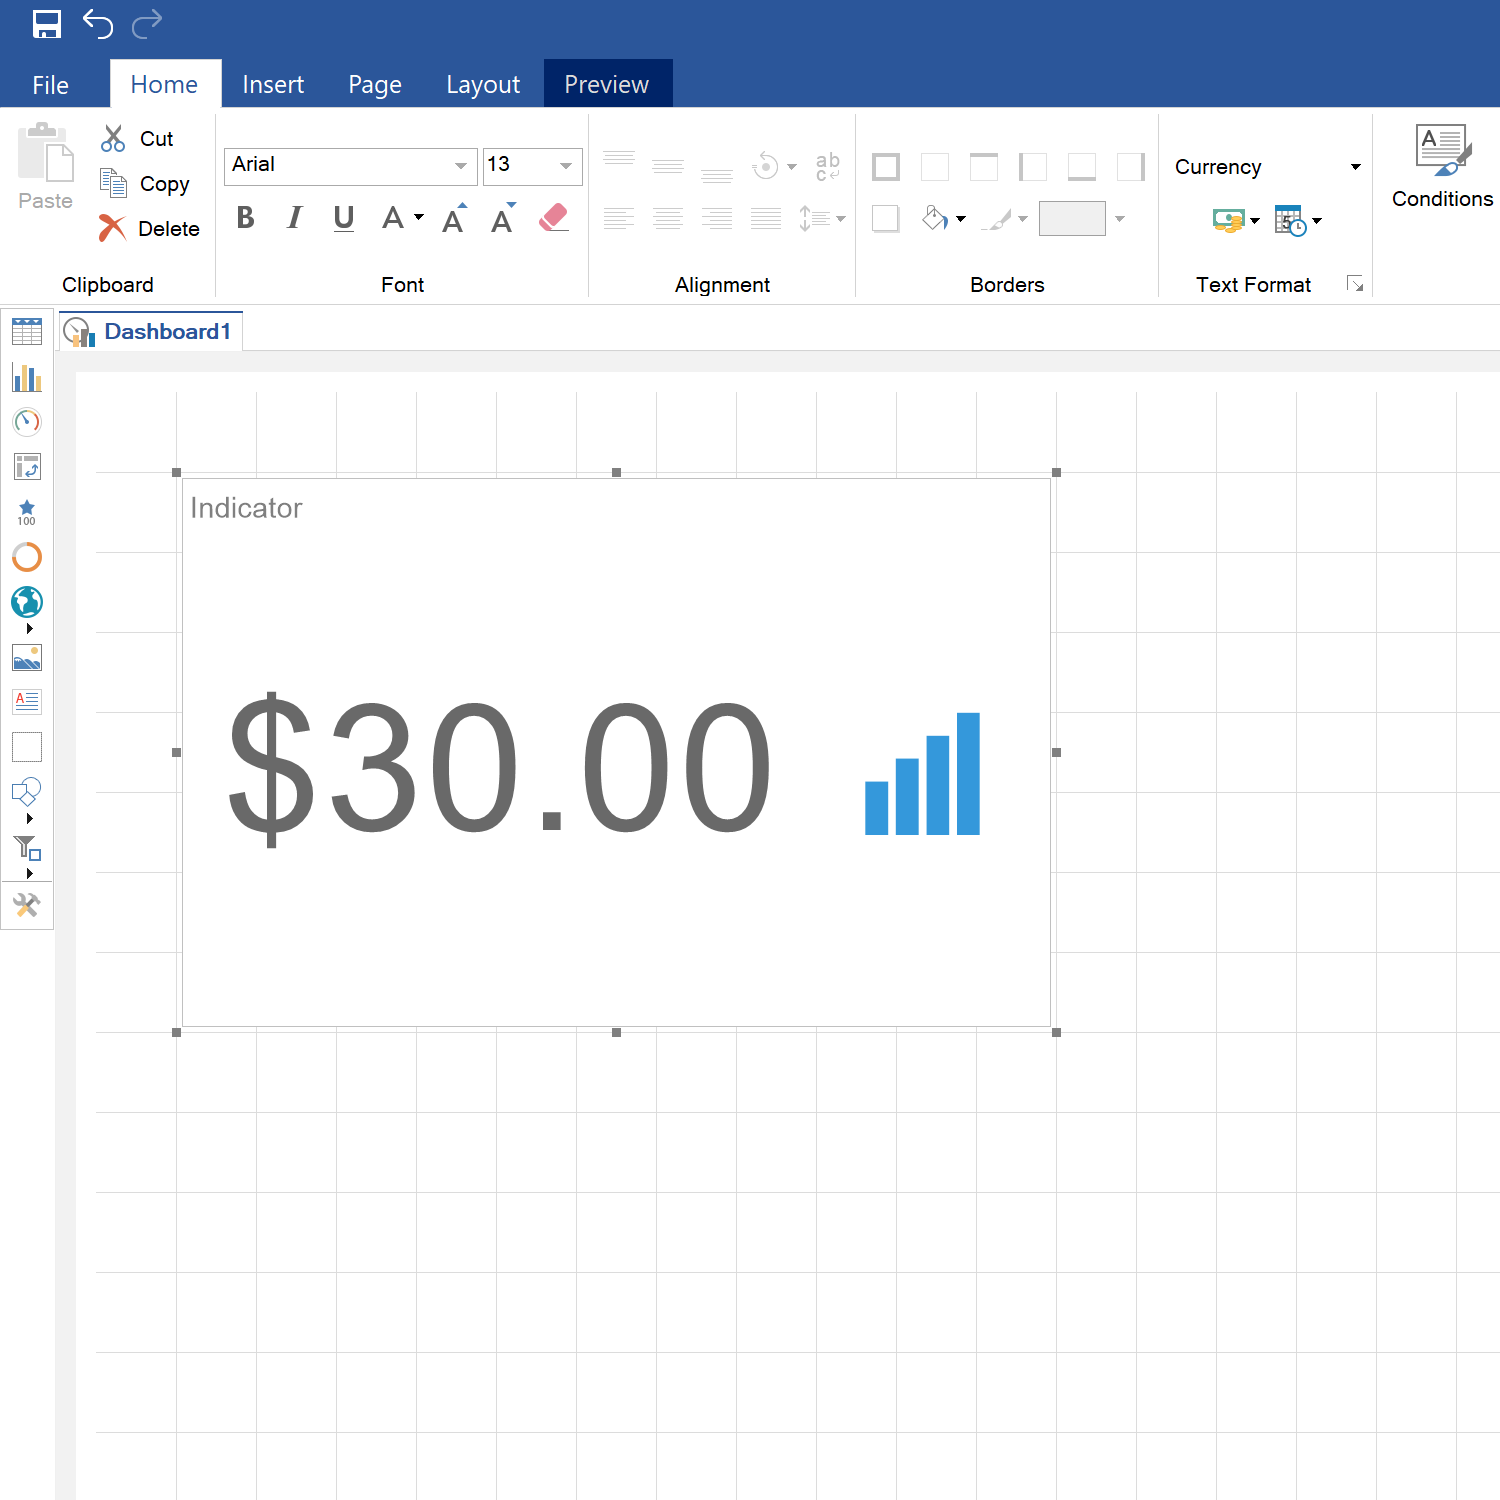
So let`s consider its applying to indicators. To do this, choose an indicator: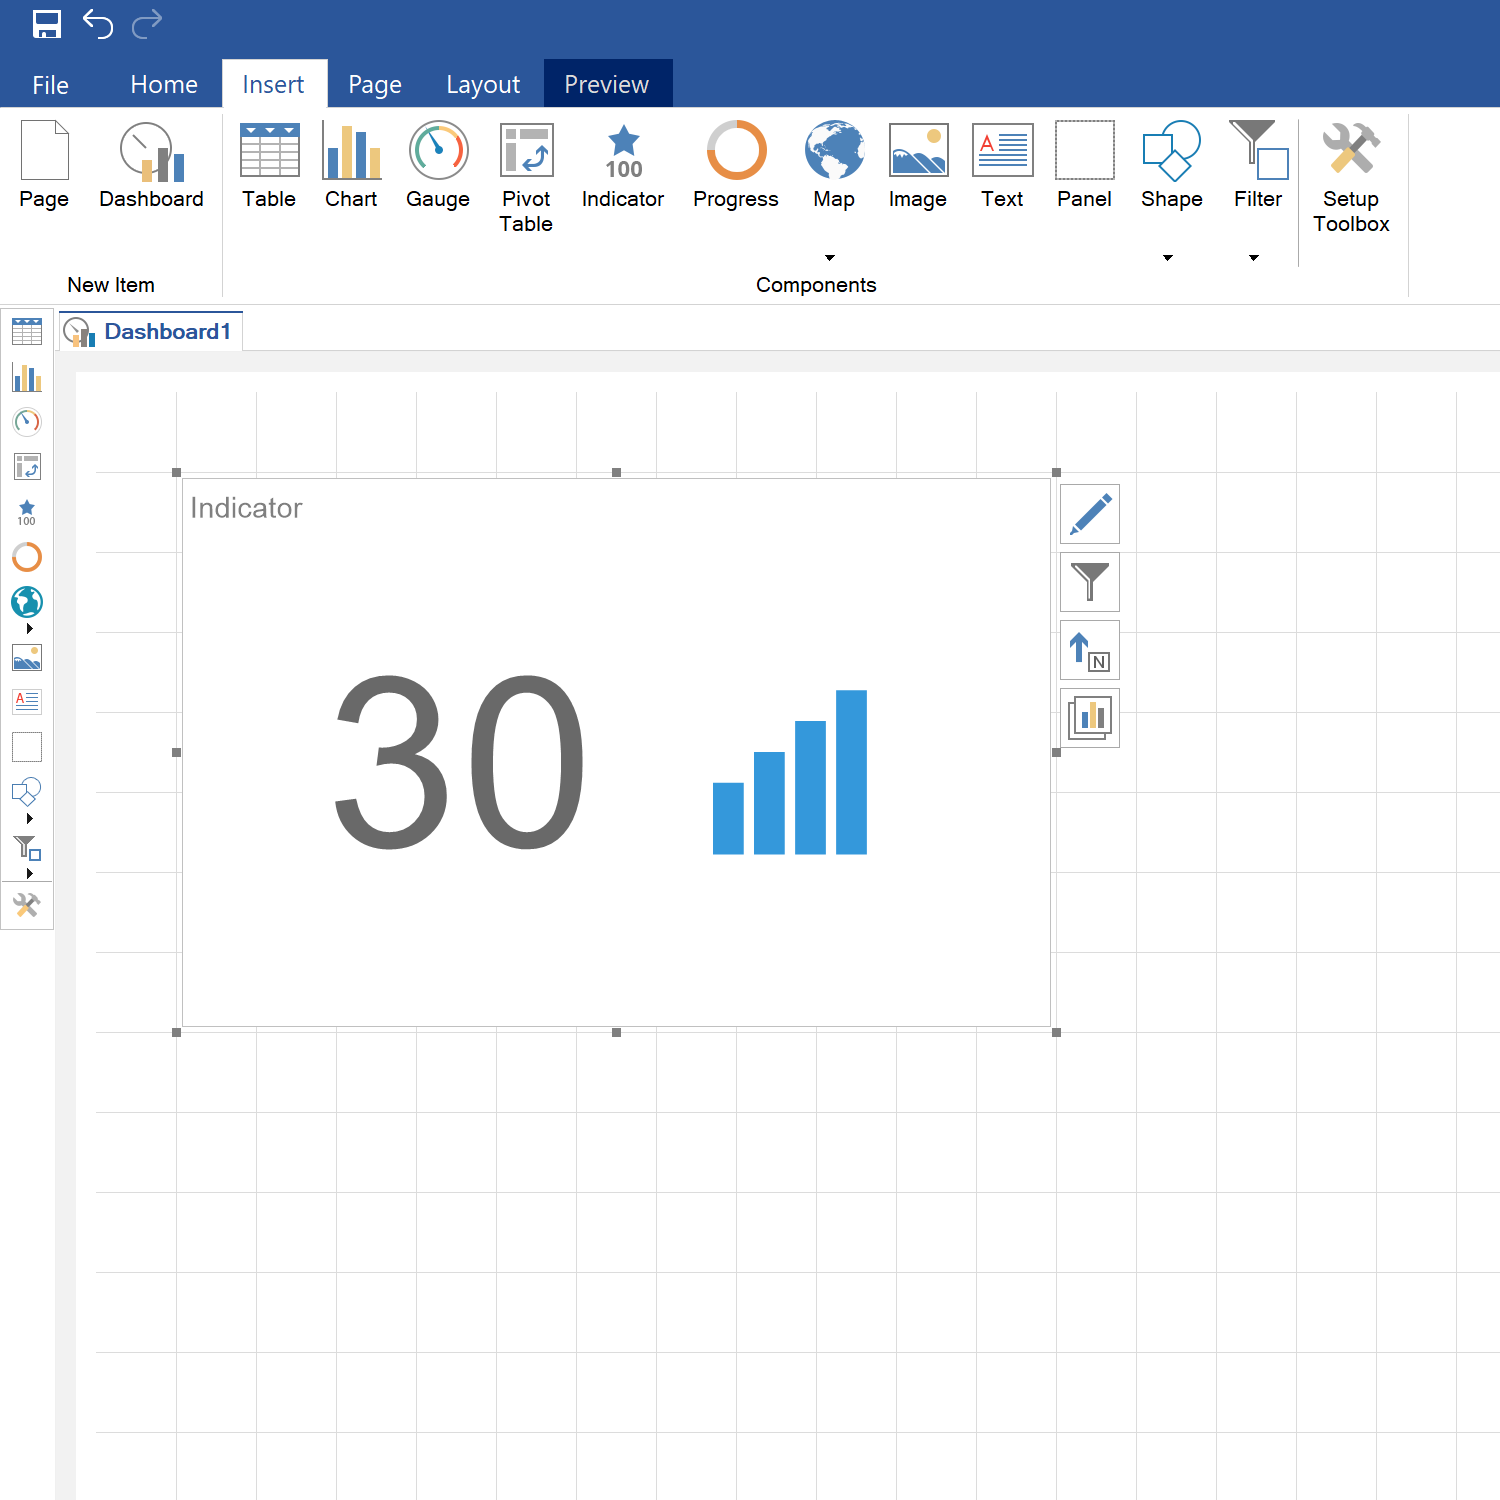
Next, go to the Home tab, then Text Format and choose Currency Format:
Set currency symbol and you get:
Chart
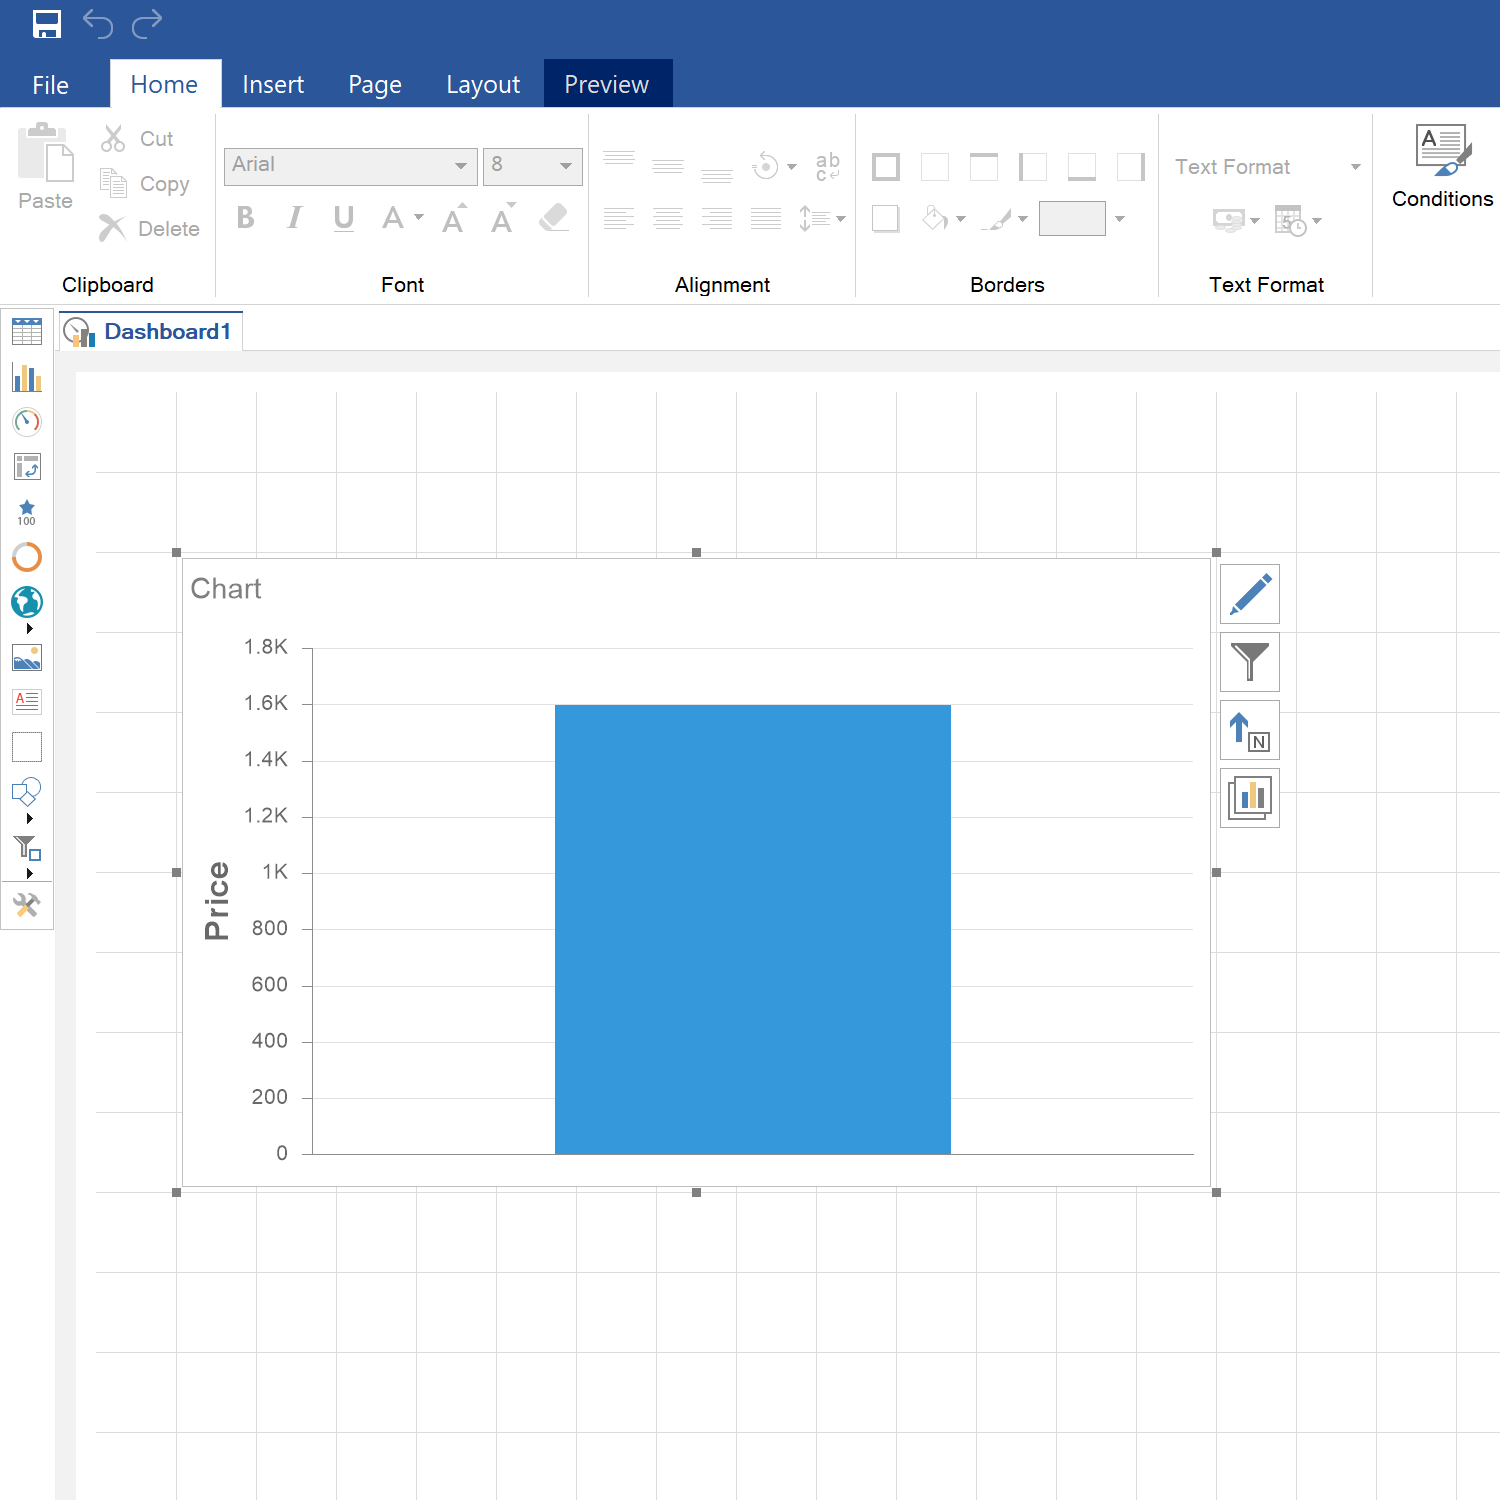
Things are a little bit different with charts. For example at your chart thousands are displayed in the standard way: "1,800"; "1,600", and you want to shorten them and give them a different look, for example like this: "1.8K"; "1.6K". How to do this? Firstly choose a chart: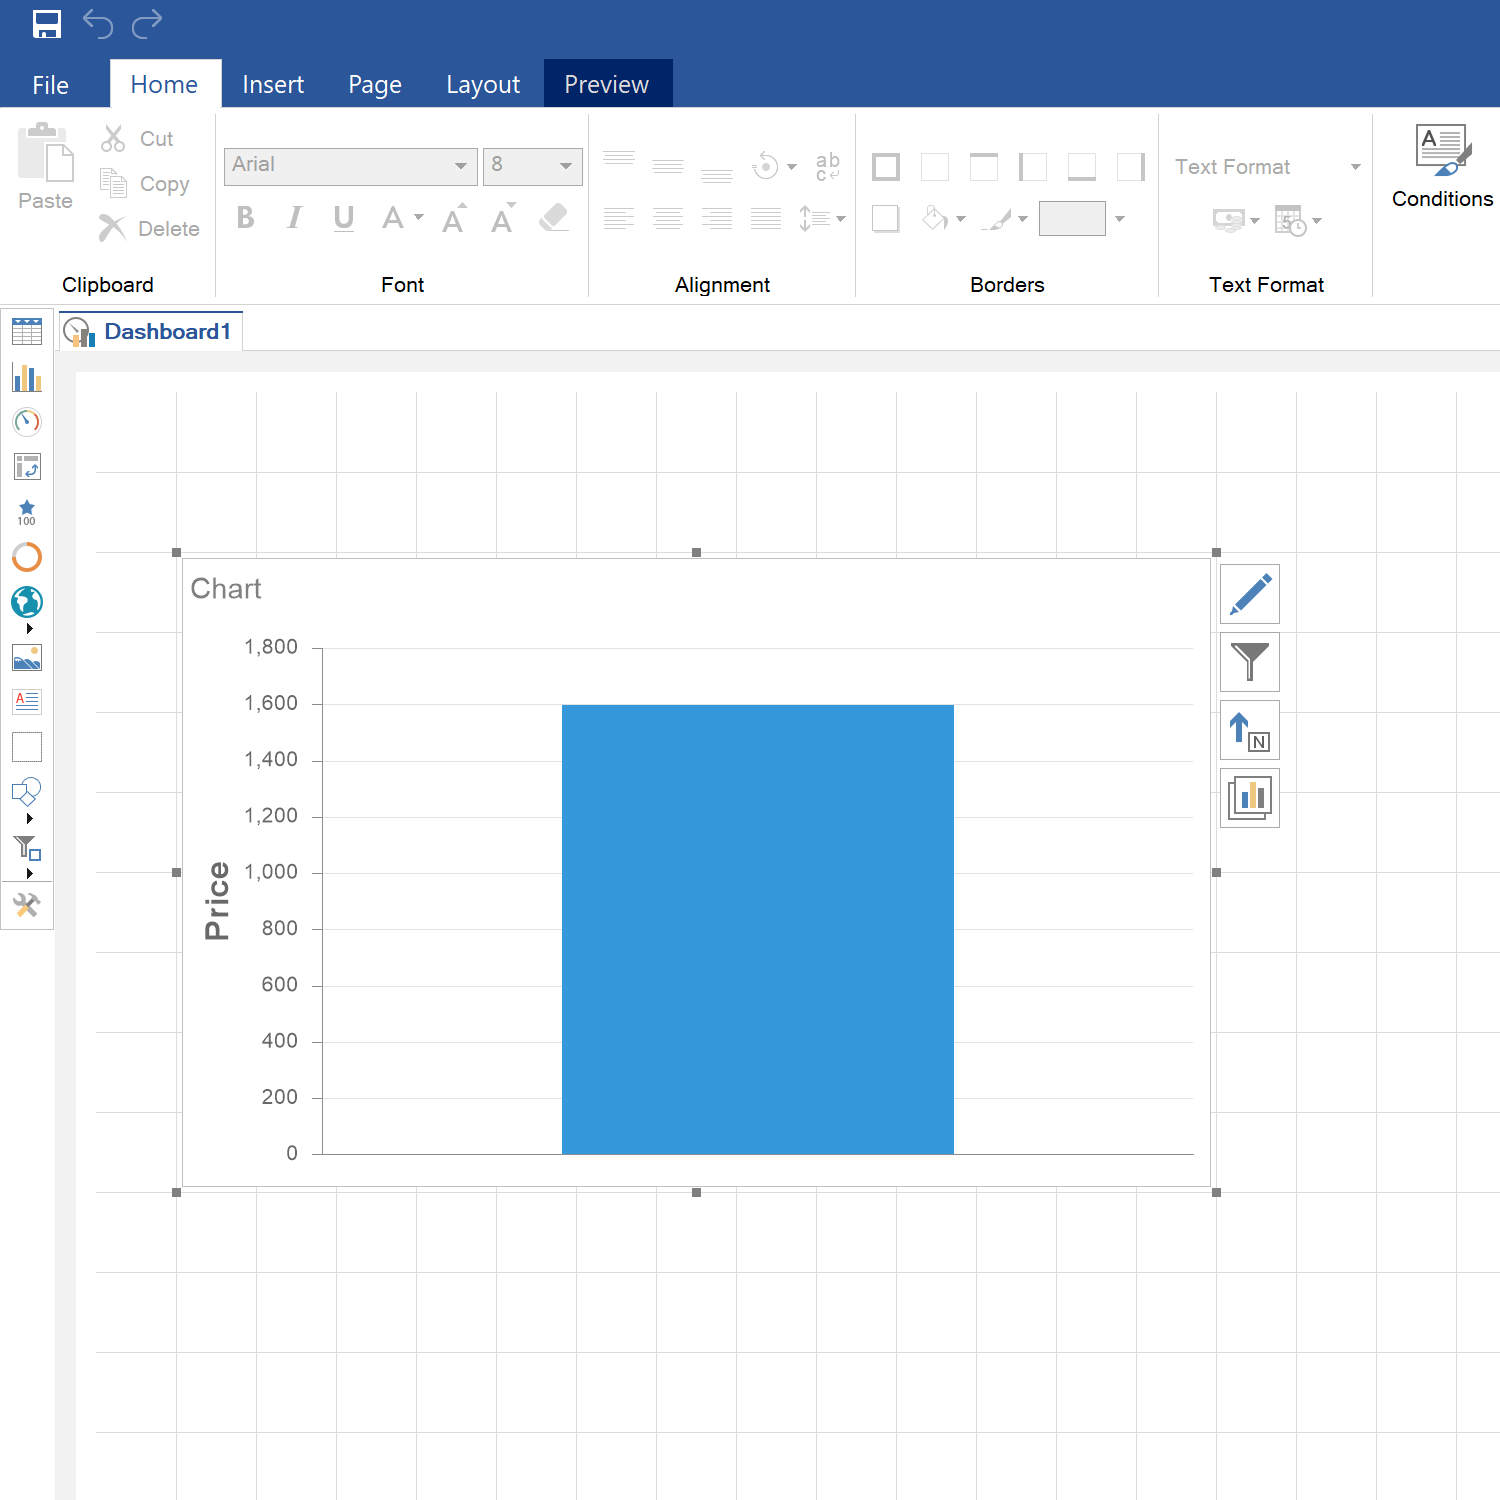
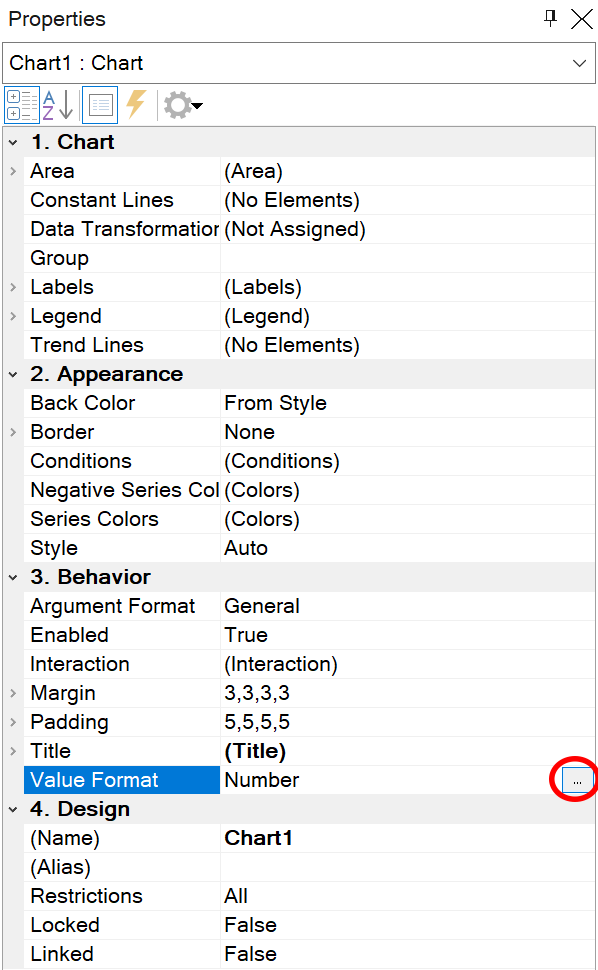
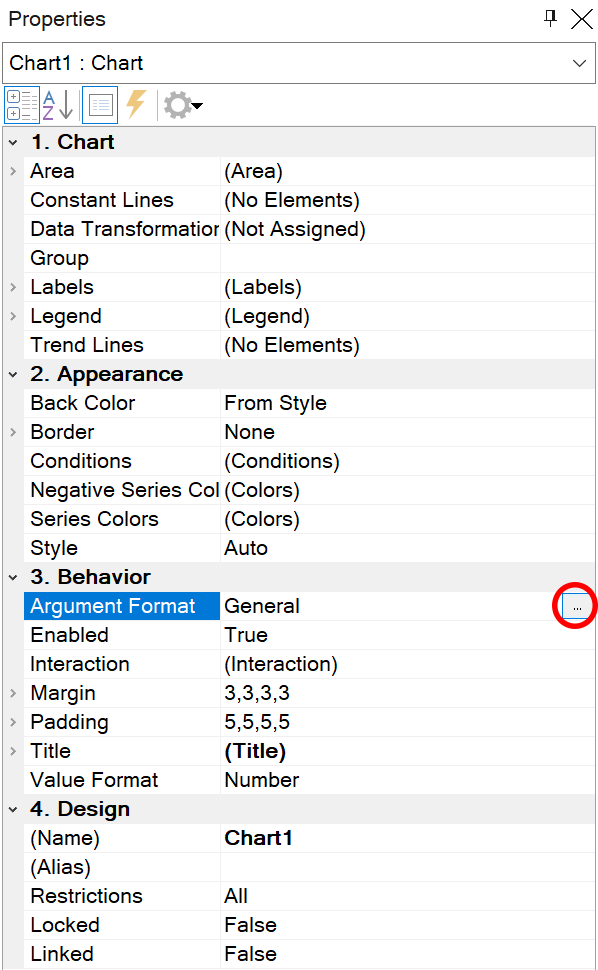
Next, go to the Properties. You can find 2 properties there: Argument Format and Value Format. Choose Value Format and click on the edge button:
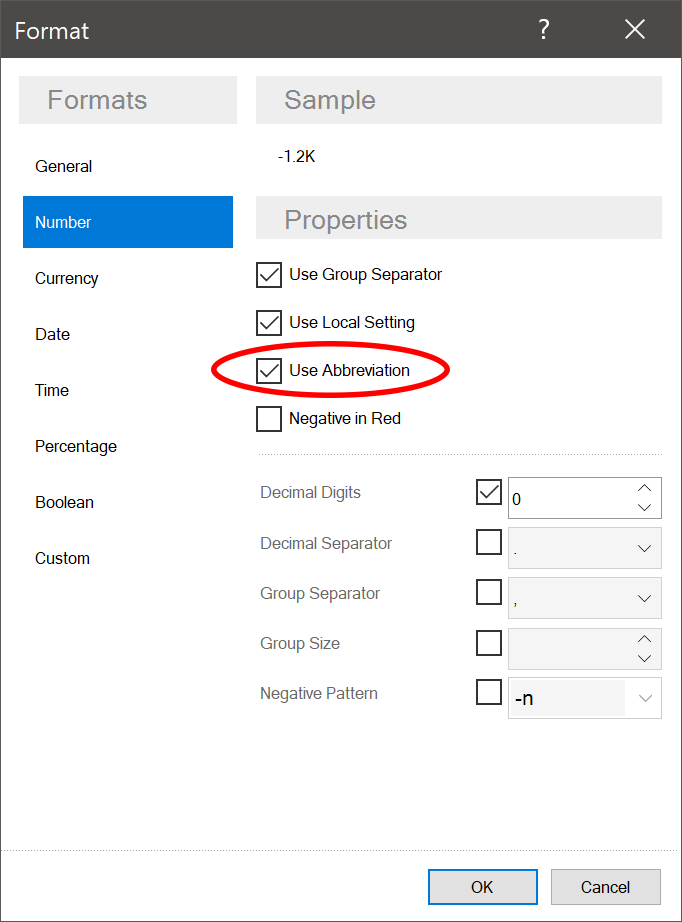
Then at the appeared Text Format form choose Number Format and activate Use Abbreviation property:
And you get a chart with formatted values:
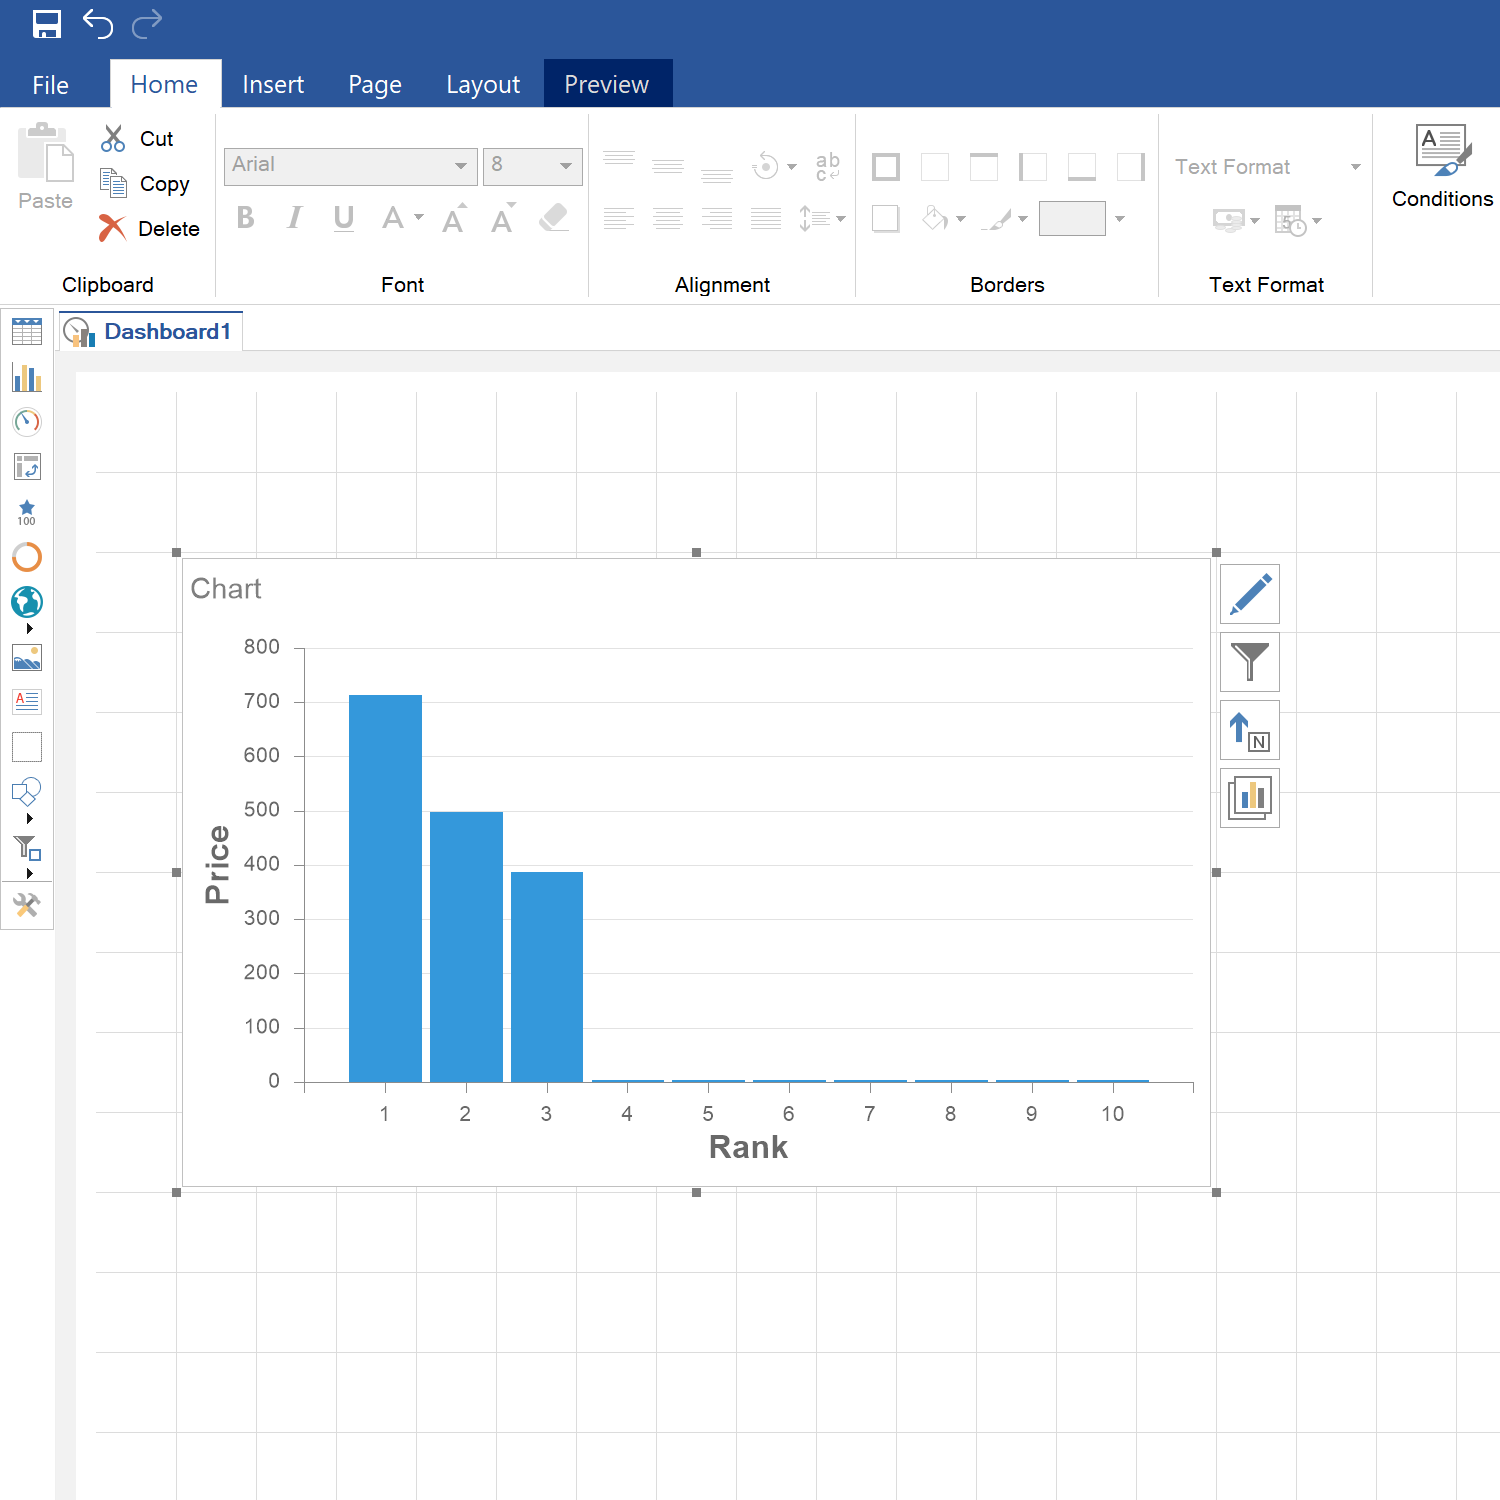
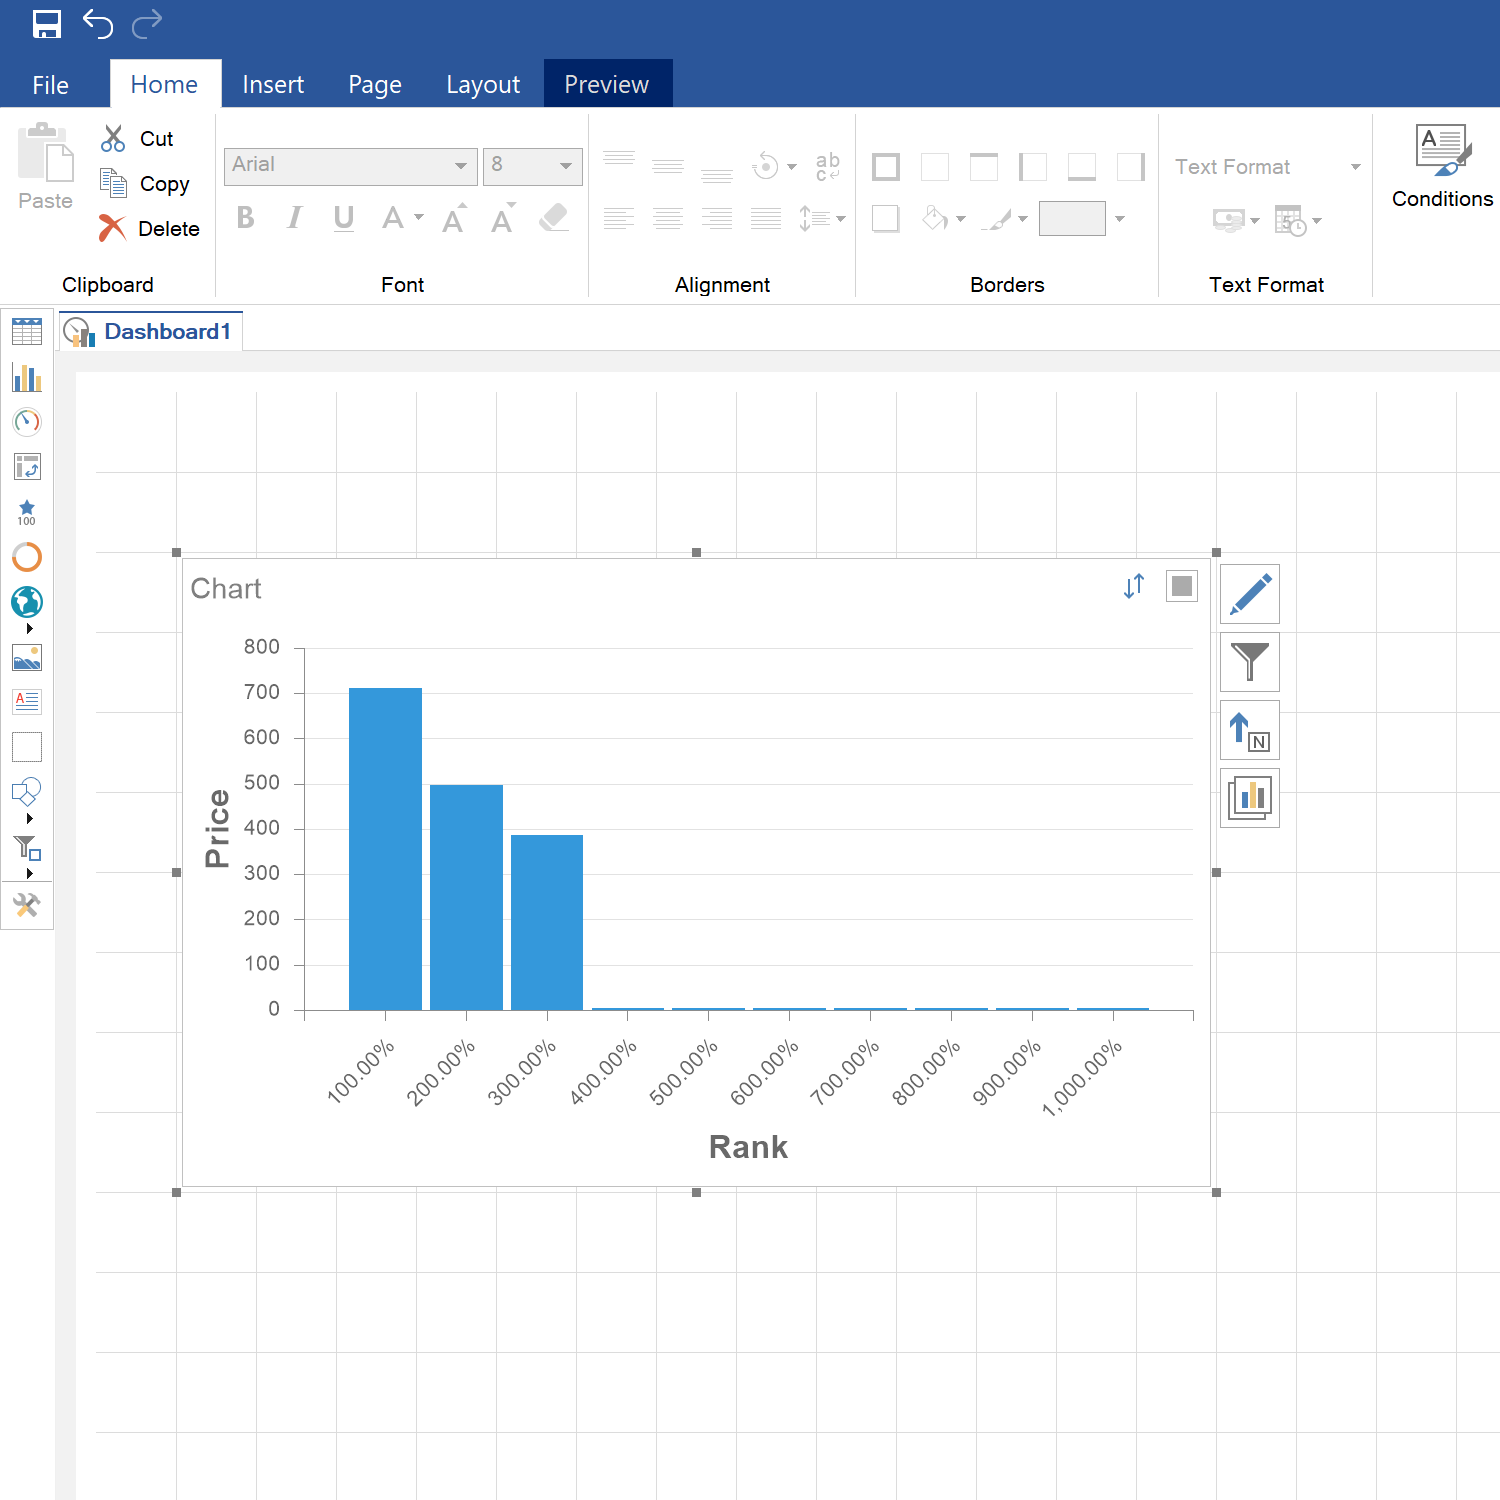
It was value axis (Y). And let`s look at applying Text Format to the argument axis. At an argument axis (X) chart you have axis values as prime numbers and you want to turn them into percentages:
To do this you should choose Argument Format and click on the edge button in properties:
Next, on the opening Text Format window you choose Percentage Format and set percentage symbol:
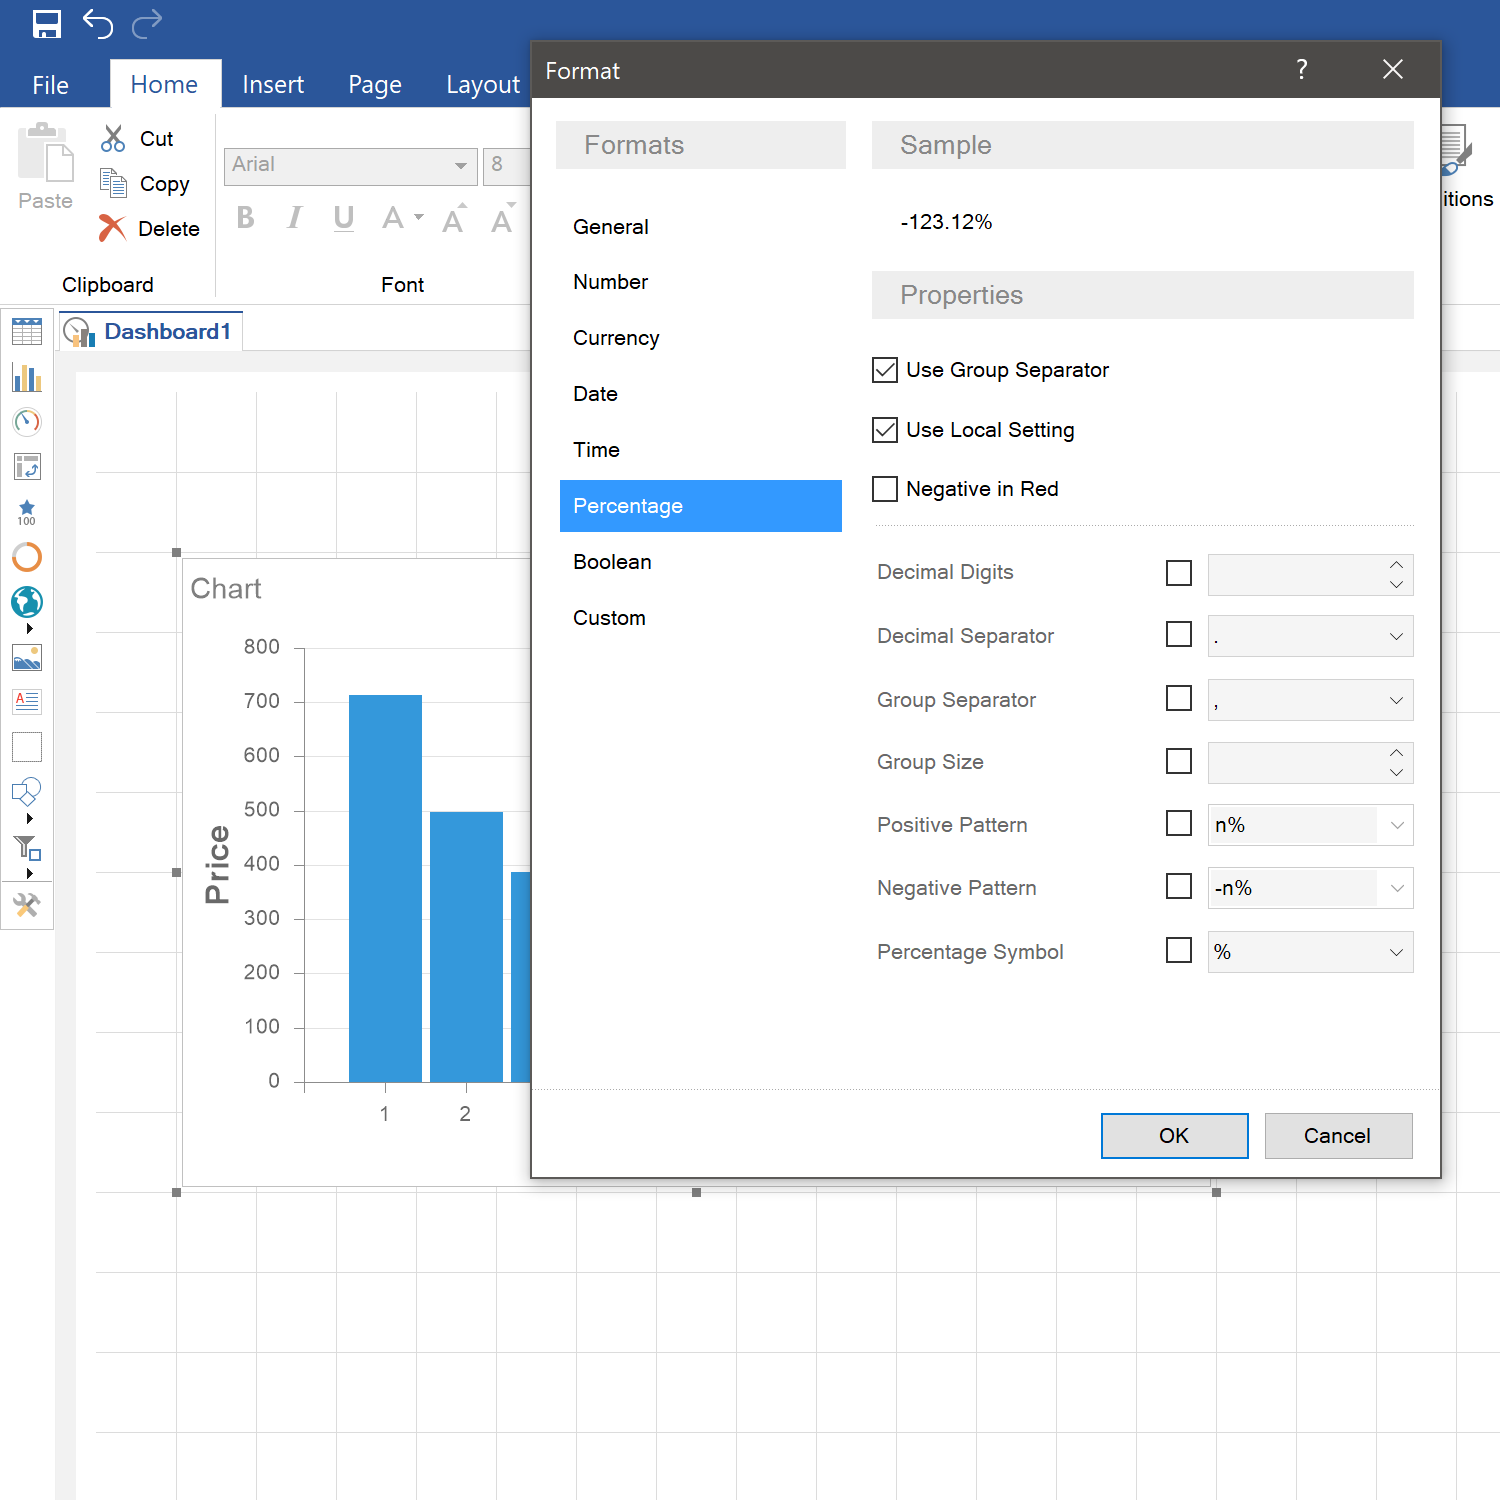
And you get the result you need:
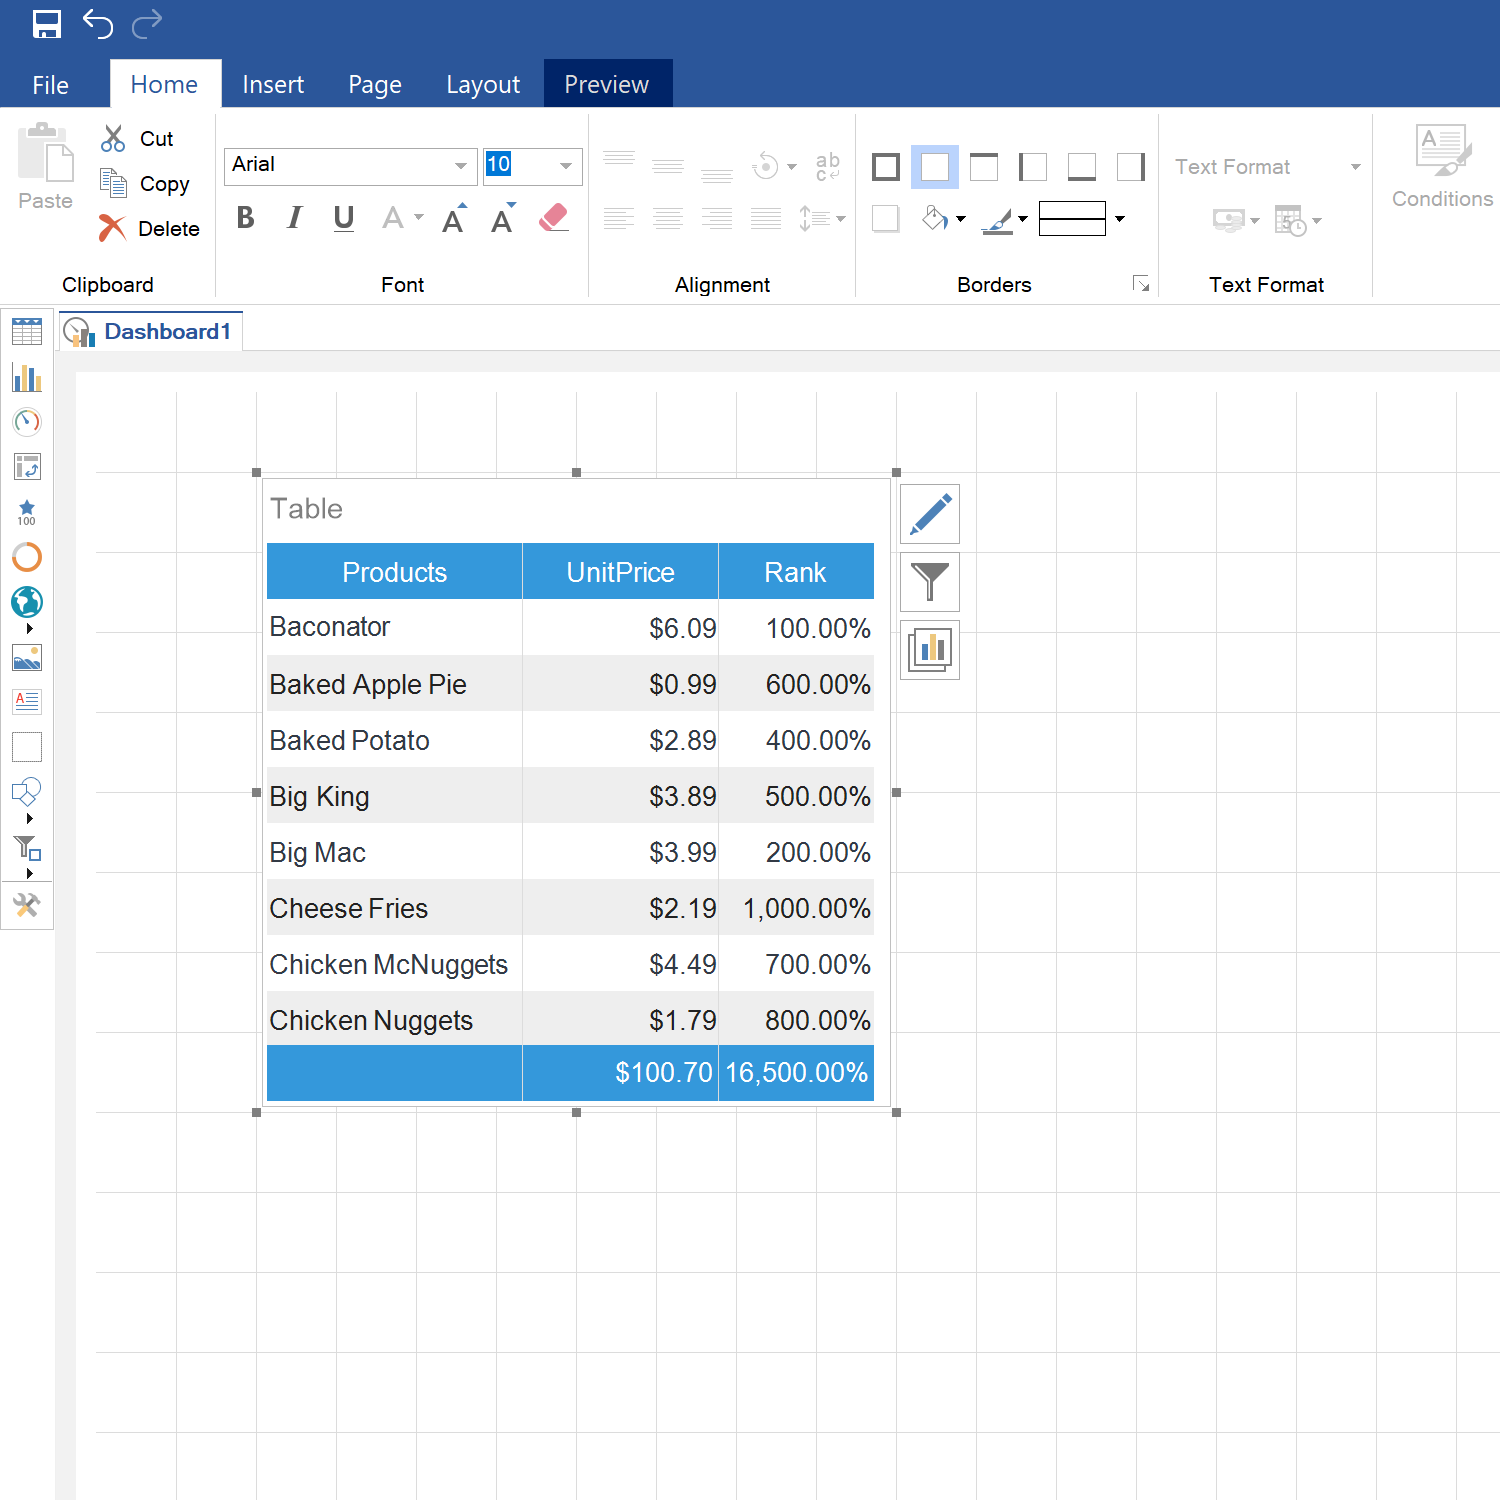
Table
In addition, there are tables in dashboards. And you can also apply Text Format to them. For example you have a table with three columns and at one of them you want to apply Percentage Format. Let`s have a look how to do it.Firstly, choose a table:
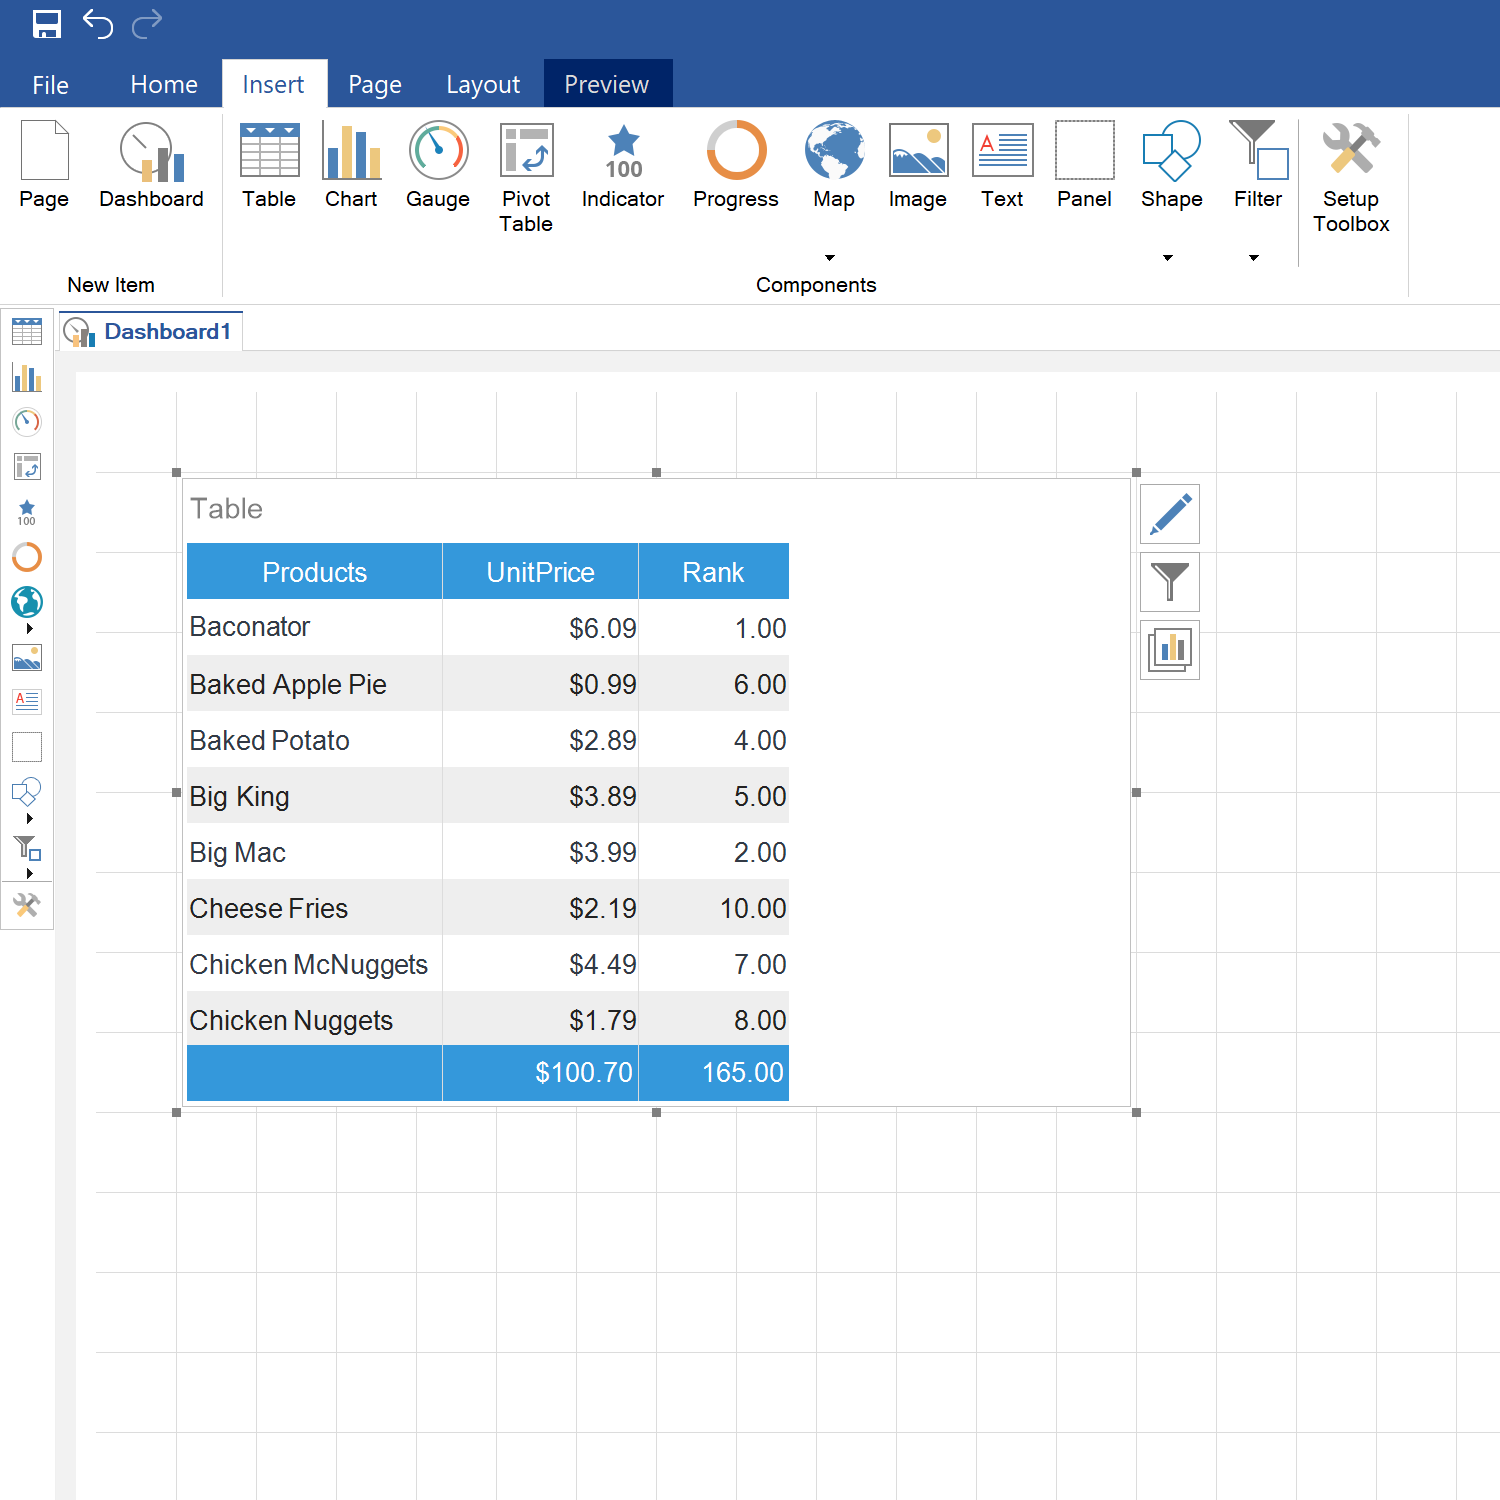
Let`s say you want to change Rank column and apply Percentage Format to it. To do this you should open a table editing form.
Next, you should highlight the column:
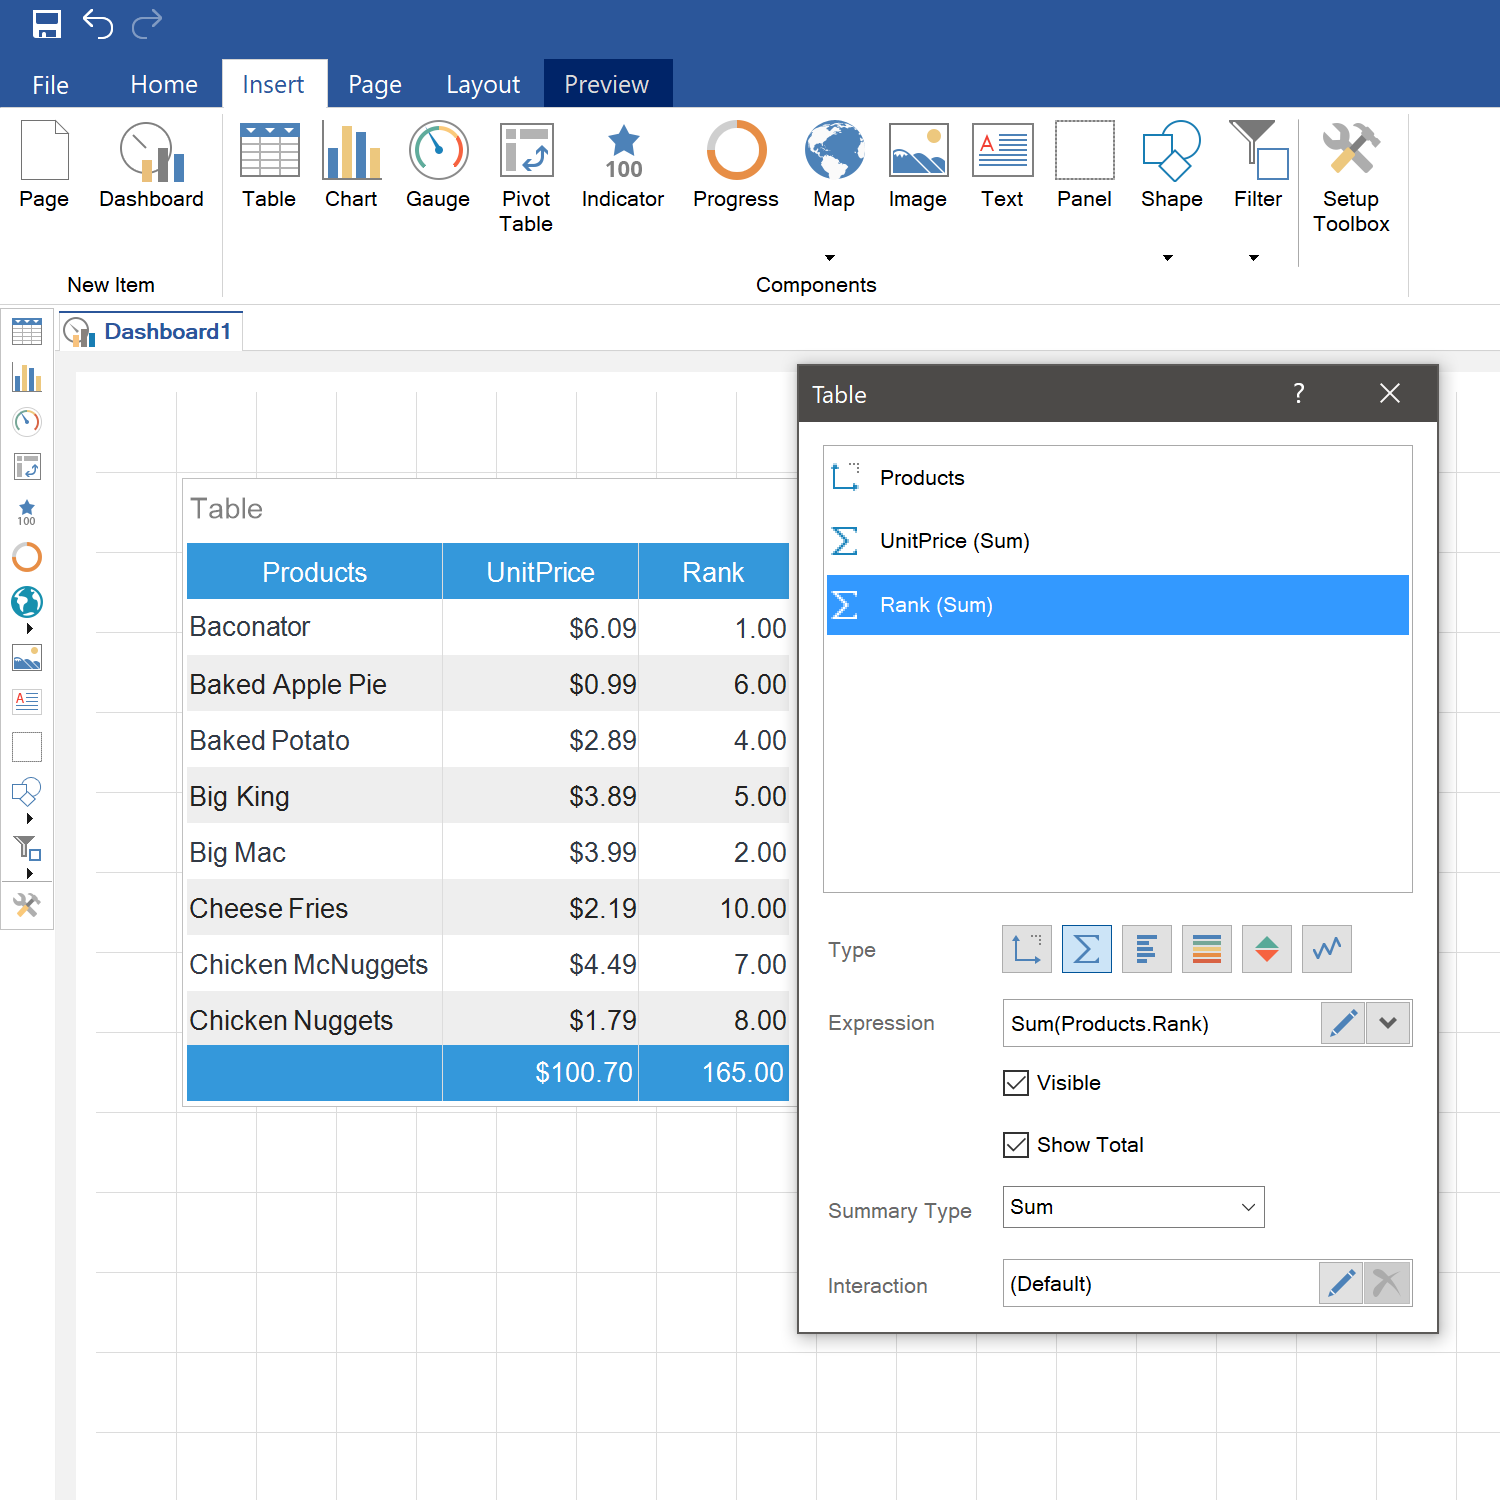
Click on the dialog box button, then go to the Home tab and in Text Format group choose Percentage Format and percentage symbol:
And you get the result you need:
We hope this article will help you to understand Text Format features of use, when creating tables, charts, indicators and the like in Stimulsoft report designer. If you have any questions, please contact us – we are always glad to help you!