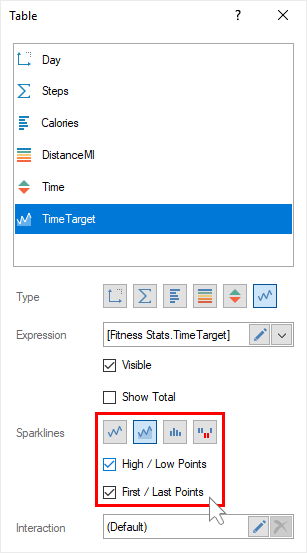
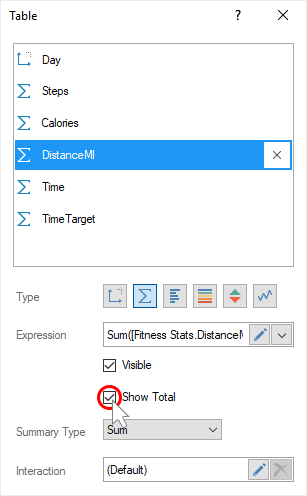
Dashboard with Chart
To create a dashboard with a Chart element, you should do the following steps:
Step 1: Run the report designer;
Step 2: Create a dashboard or add it to a current report;
Step 3: Connect data;
Step 4: Select the Chart element in the toolbox of the report designer or on the Insert tab;
Step 5: Put the item on the dashboard panel;
Step 6: If the item editor did not open, double-click on the chart;
Step 7: Drag the required data columns from the data dictionary;
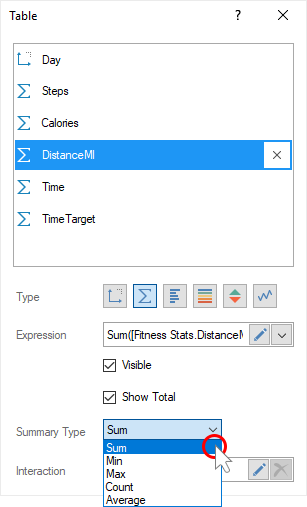
Step 8: By default, columns will be added to the Values field of the chart;
Step 9: Select the field of values;
Step 10: Click the Browse button in the Expression field and select the function of aggregating values, if necessary. By default, the Sum() function is used, which sums the values from the specified data column.
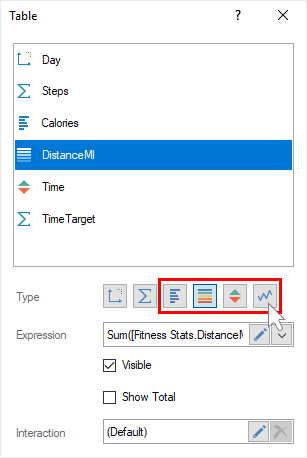
Step 11: Change the type of a chart, if necessary;
Step 12: Drag the data columns into the Arguments and Series fields, if necessary;
Information |
For some types of charts, you should specify columns of values in several fields. For example, for financial charts, you should add data columns to the fields Open Values, Close Values, Maximum Values, and Minimum Values.
|
Step 13: Close the editor of the Chart element;
Step 14: Go to the preview tab.