

Stimulsoft Reports.PYTHON
A powerful and modern reporting tool for Python services
Stimulsoft Reports.PYTHON comprises a set of components for creating, viewing, exporting, and printing reports in applications and projects written in Python. The product supports connections of multiple data types, allowing you to work with reports using client-server technology, and also offers extensive capabilities for data visualization and analysis.Product functionality
The report writer for Python offers excellent web components and a powerful JavaScript data processing engine, dozens of types of charts, tables, barcodes, and other reporting elements for presenting data, filtering, and sorting. It supports multiple export formats, the ability to share ready-made reports, and much more.Product features
Stimulsoft Reports.PYTHON is based on client-server technology: a Python application on the server-side and a JavaScript reporting engine on the client-side. These two parts are closely related and represent a single product that greatly simplifies working with reports in web applications written in Python.Python
The server-side manages report files, enables working with various databases, facilitates transparent event processing, and deploys HTML and JS code on the page - all you need to do is write a few lines of code in Python.
JavaScript
The client-side builds and exports the report. The visual part is presented as a Single-page application or as an embedded component. Numerous settings significantly expedite the deployment and simplify working with reports.
Report designer
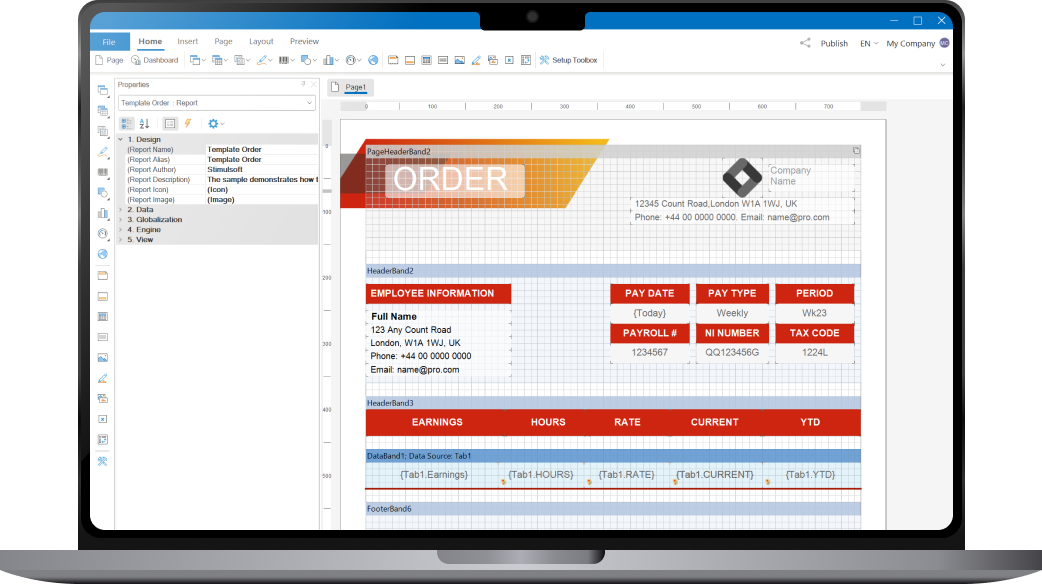
The designer is directly responsible for creating reports - it is here that you can connect the necessary data from various sources: SQL, web services, XML, JSON, Excel and other file sources, select components for their visualization - charts, maps, cross-tabs and much more other, as well as visually design the template using a variety of styles.For Reports.PYTHON, the report designer is available in three versions:
- A component for integration into Python applications;
- A standalone BI Designer application for working on Windows, macOS and Linux operating systems;
- An online service designer.stimulsoft.com with the same functionality.
You can use all versions at once, they are fully compatible with each other. In this case, the component is licensed according to the royalty free model, that is, there are no additional royalties when your users create documents.
Data for reports
Our reporting tool supports many ways to connect data to a report using both the report designer functionality and code. We offer a vast list of supported data servers – MS SQL, Firebird, MySQL, PostgreSQL, etc. We support all standard types of OData protocol. You can get data from XML, JSON, Excel, and other files.Report Viewer
The viewer is a special component for viewing reports, a task that is performed much more frequently than creating or editing one, making this process more crucial. Therefore, the report viewer must be fast, convenient, and fully customizable. Our component supports working with parameters, multi-level drill-down, interactive reports, working with resources, and much more. For integration into projects, we offer numerous design themes and options for customizing the appearance and functionality of the application.Loading...

Event handler
A special feature of Reports.PYTHON is its flexible event handler, which enables you to execute necessary actions on both the JavaScript client-side and the Python server-side. There is no need to worry about how to transfer data from the client-side to the server-side, process it, and transfer it back. Simply add the necessary lines of code to process and correct the required data; everything else will be handled automatically.Integration
We endeavored to develop a product for the simplest possible integration of a JavaScript reporting tool into any Python web projects. Special functions have been added to facilitate integration into projects using popular web frameworks such as Django, Flask, and Tornado. To enable the components to function fully, simply install the Python package and add just a few lines of code to the project; all HTML and JS code will be deployed automatically. Django
 Flask
Flask Tornado
Stimulsoft Ultimate
Stimulsoft Reports.PYTHON is part of Stimulsoft Ultimate, a comprehensive All-in-One set of products designed for working with data on all modern platforms such as .NET, ASP.NET, JavaScript, Java, PHP, Blazor, Angular, WPF, WinForms, Avalonia UI, Python, and others. With our components, you can create, print, export complex reports, analyze data using clear and colorful dashboards, and collect data from users through interactive forms.What's next?
We have prepared hundreds of reports and dashboards templates grouped by spheres of use. You can immediately use them by connecting your data or change according to your requirements. Our lessons and technical documentation will help make your work effective! Moreover, you can request the training courses from our technical specialists, subscribe to our YouTube channel to always get new videos, and receive all your answers in our online documentation.
Training courses
Are you faced with difficulties when creating reports and dashboards? This is not a problem!
Video lessons
We have prepared many video materials for the designing reports and dashboards. All tutorials are grouped by specific topics and regularly updated and supplemented.
Documentation
Our online user guides describe both the general functionality of the product and provide advice and suggestions for the report design and hints of setting components for reporting.