Stimulsoft Dashboards
Embeddable dashboards for your applications
The Stimulsoft Dashboards product line consists of components designed for embedding into applications and projects developed on various platforms, including ASP.NET, ASP.NET Core, .NET Core, WinForms, WPF, PHP, Blazor, Angular, Python and JavaScript. Additionally, it includes the cloud service designer.stimulsoft.com and the desktop Stimulsoft BI Designer application. With our products, you can create and view interactive dashboards, selecting the metrics essential for your business.Dashboards created in Stimulsoft
Data visualization and analysis for business
Access any data for
effective analysis
Presenting information
in a professional way
Shared
decision-making
Data for dashboards
One of the key advantages of our product is the diversity of data it supports for creating dashboards in your application. We provide an extensive list of supported data servers—MS SQL, Firebird, MySQL, PostgreSQL, etc. Additionally, you can import data from various file sources such as XML, JSON, Excel, and others.Creating and viewing dashboards
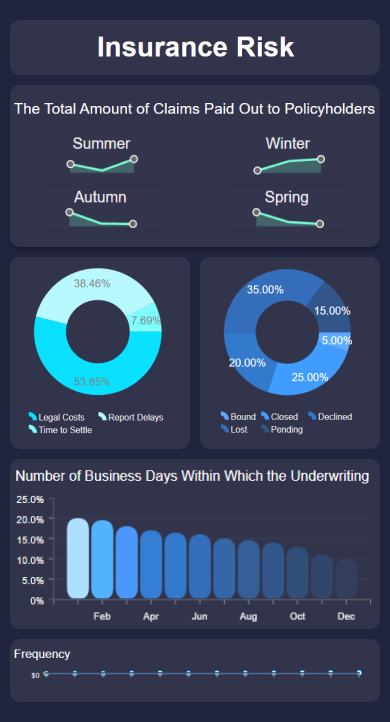
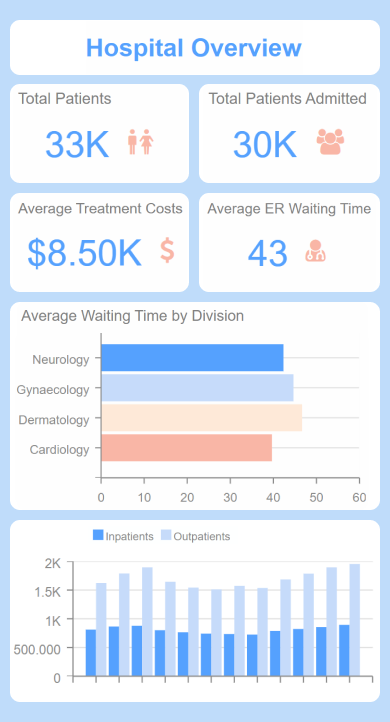
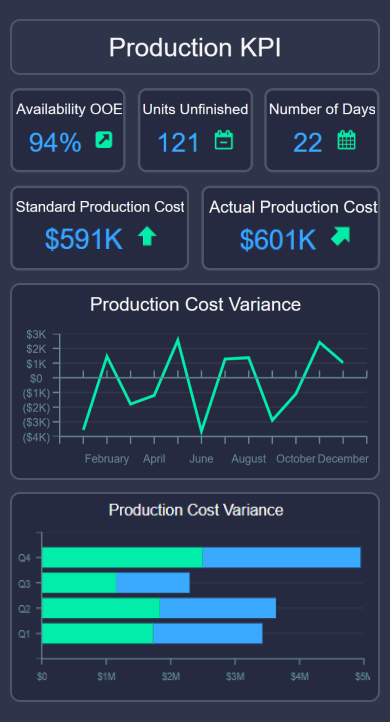
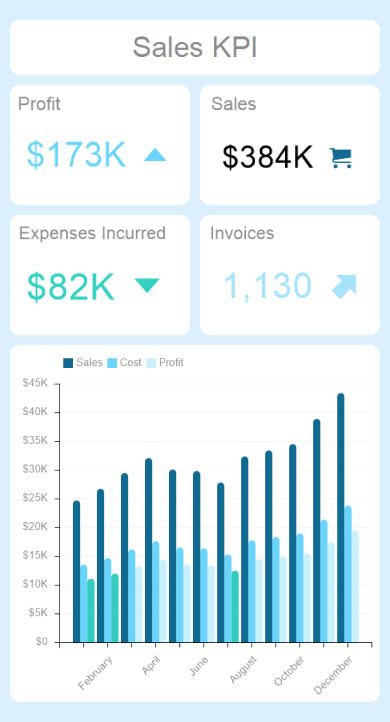
In each product of the Stimulsoft Dashboards product line, you will find extensive functionality for creating dashboards, options for customizing the appearance, and numerous solutions for data analysis and visualization.

9 Supported Platforms
We offer products for integration into applications written in .NET, ASP.NET, JavaScript, Angular, WPF, WinForms, Blazor, Python, PHP, and other frameworks.

15+ Elements for Analytics
There are a lot of elements for creating and editing dashboards, from shapes to buttons, that execute various scripts.

11 Preset Styles
More than 10 preset styles and the ability to add your own will give dashboards the desired look.

40+ Chart Types
In our products, you will find dozens of charts, ranging from bar charts and pie charts to line graphs, including 3D options.

18 Export Formats
Our products support exporting to multiple formats, including PDF format with support for signatures and encryption, HTML, MS Excel, Word, and many other document and image formats.

30+ Interface Localizations
The UI is translated into 30+ languages, which completely breaks the language barrier.
Functionality of Stimulsoft BI solution
Our data analytics and visualization system offers flexible settings and a wide array of possibilities for representing data on dashboards. In addition to supporting numerous data sources, visualization elements, and export formats, our product also includes:While viewing a dashboard, you can filter data by a specific value, configure sorting, and group different dashboard elements.
You can apply date functions (such as day of the week and year), mathematical functions (finding minimum/maximum values), summation functions (sum, average value, etc.), and other functions to the data fields of dashboard elements.
This feature involves highlighting the values of dashboard elements based on given conditions. It allows you to define text formatting, background, borders, and add or change icons.
The system provides the ability to use dashboard variables as parameters, allowing you to select and enter custom values to filter the data of dashboard elements or in a query to the data storage.
Our product allows you to use expressions in the fields of dashboard elements, incorporating various mathematical operations for the values of data columns, variables, and constants.
This functionality provides a wide range of options, from drilling down into the data of a dashboard element to displaying another dashboard or report, with the ability to transfer parameters to it.
Integration
Our data analytics and visualization product is designed for integration into web projects built using the ASP.NET, ASP.NET MVC, .NET Core, JavaScript, PHP, WPF, WinForms, Angular, Blazor and Python platforms. You can control all stages of dashboard work, from data loading and connection to viewing and printing the final document. In addition to a wide range of visual components, any actions can be performed using server-side code. JavaScript
 ASP.NET
 Angular
 Blazor
 React
React Vue.js
 ASP.NET MVC
 Node.js
 .NET Core
 PHP
PHP WPF
WPF WinForms
Licensing terms for the Stimulsoft Reports product line

Developer-based licensing
We provide four types of licenses for our products, depending on the number of application developers or report creators. You can find detailed information about each license type here.
Free 30-day trial
To allow you to evaluate our products, we offer a free 30-day trial period. During this time, you will have full access to all the features and capabilities of our products.
No hidden fees
When integrating our product into your applications, you are not required to make any additional payments (royalty-free). This means that you can distribute our product as part of your application without any extra financial obligations for your customers.


