At the end of September 2015 we will release the new versions of reporting tools – 2015.2. One of important changes is a brand new report component - Gauge.
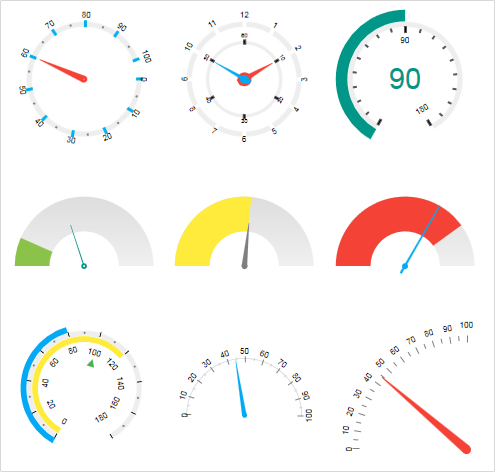
The information in the reports looks better if it visualized. One of the tools for data visualization is the Gauge component. This one is designed to display a specific value out of the range of values. Gauges are divided into linear and radial. From the release of 2015.2 in the reporting tools Stimulsoft Reports.Net and Stimulsoft Reports.Wpf will have the Gauge component.

Gauges are presented as a separate component in the report designer. This component has a fully functional editor, with help of what the gauges can be configured.

The information in the reports looks better if it visualized. One of the tools for data visualization is the Gauge component. This one is designed to display a specific value out of the range of values. Gauges are divided into linear and radial. From the release of 2015.2 in the reporting tools Stimulsoft Reports.Net and Stimulsoft Reports.Wpf will have the Gauge component.
Gauges are presented as a separate component in the report designer. This component has a fully functional editor, with help of what the gauges can be configured.