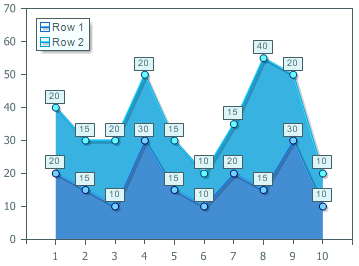
Graphical representation of data is now possible in Stimulsoft Reports.Silverlight. We added the Chart component that is used to create and output graphs in a report page. The following types of charts are available: Column Area, Bar Area, Pie Area, Line Area, Area, Gantt Area, Spline, Spline Area, Scatter Area. Each chart type has numerous properties which allow you to customize a chart according to your requirements. In the prerelease build of the product from November 16, 2010 this feature is already included and available for evaluation. You may download the prerelease build here.