ColorEach Property
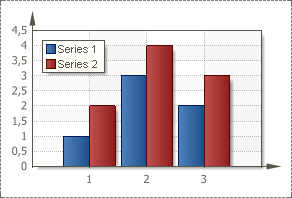
The Color Each property is used (depends on the selected style) to set color for each value of a series. By default, the Color Each property is set to false, columns of one row have the same color. The picture below shows an example of a chart with the Color Each property set to false for two series:
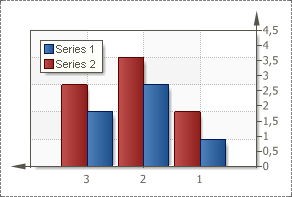
If the Color Each property is set to true, then each value of X axis has its own color. The picture below shows an example of a chart with the Color Each property set to true for two series: