Ticks
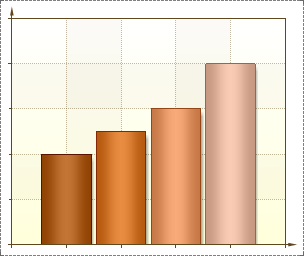
Ticks are horizontal (for the Y axis) and vertical (for the X axis) lines, which visually show the unit interval and the proportion of segments. Under the Ticks labels are displayed. The picture below shows a chart with ticks:
Ticks have the following properties:
![]() Length is the length of ticks, under which Labels are placed;
Length is the length of ticks, under which Labels are placed;
![]() Minor Count allows changing the number of intermediate lines (Minor ticks);
Minor Count allows changing the number of intermediate lines (Minor ticks);
![]() Minor Length is the length of the intermediate lines (Minor ticks);
Minor Length is the length of the intermediate lines (Minor ticks);
![]() Minor Visible is used to show/hide the intermediate lines (Minor ticks);
Minor Visible is used to show/hide the intermediate lines (Minor ticks);
![]() Step controls the step of the unit interval, distance between ticks;
Step controls the step of the unit interval, distance between ticks;
![]() Visible is used to show/hide Ticks, both basic and intermediate.
Visible is used to show/hide Ticks, both basic and intermediate.