Range Property
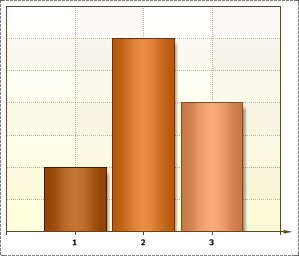
The Range property is used to display the specified section of a chart. So a part of the chart within the specified values will be shown. The picture below shows a chart with the Range property set to the X-axis from 2 to 4:
The Range consists of the values of three fields:
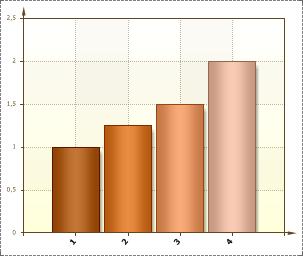
![]() Auto. If the Auto field is set to true, then a chart is shown entirely, the range of values will be calculated automatically. The picture below shows an example of it:
Auto. If the Auto field is set to true, then a chart is shown entirely, the range of values will be calculated automatically. The picture below shows an example of it:
If the Auto field is set to false, then all values of the range which are specified in the Minimum and Maximum fields are considered. If the Auto field is set to false, and values the Minimum and Maximum fields are set to 0, then the chart will be shown entirely.
![]() Minimum - sets the beginning of the range.
Minimum - sets the beginning of the range.
![]() Maximum - sets the end of the range.
Maximum - sets the end of the range.
If the Maximum value is less then the Minimum value, then the chart will be displayed entirely.