Rendering Order of Bands
In this article, let's review the process of rendering report bands and define their relationships within the first level of nesting. By the first level of nesting, we mean that the report will not have a hierarchy, but rather consist of simple lists, groups, etc. All bands can be categorized into the following types.
![]() Page Header and Page Footer, Overlay are page bands. These bands are related to the report pages, and are displayed on each page of the report;
Page Header and Page Footer, Overlay are page bands. These bands are related to the report pages, and are displayed on each page of the report;
![]() Report Title and Report Summary are report bands. As evident from their group name, these bands are interconnected with the report and are used to display the title and summary in reports. They are displayed only once;
Report Title and Report Summary are report bands. As evident from their group name, these bands are interconnected with the report and are used to display the title and summary in reports. They are displayed only once;
![]() Data Band, Hierarchical Band are list bands. In the following text, when referring to the Data Band, we also imply that it can be used as a substitute for the Hierarchical Band;
Data Band, Hierarchical Band are list bands. In the following text, when referring to the Data Band, we also imply that it can be used as a substitute for the Hierarchical Band;
![]() Bands associated with the Data Band are Header Band, Footer Band, Group Header Band, Group Footer Band, Column Header Band, Column Footer Band, Empty Band;
Bands associated with the Data Band are Header Band, Footer Band, Group Header Band, Group Footer Band, Column Header Band, Column Footer Band, Empty Band;
![]() The Child Band.
The Child Band.
All bands are displayed in the strict order. This is due to the fact that each band has a specific function in the report. And it is very important in which order bands are printed.
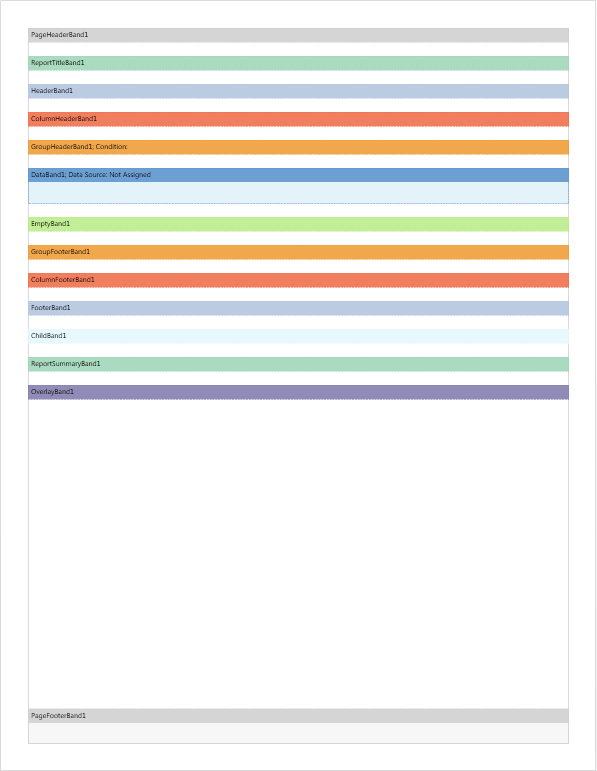
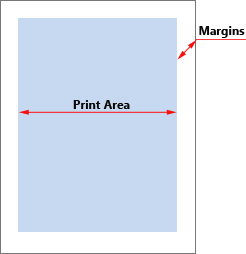
The Child Band can be placed on any band except the Page Header, Report Summary, Page Footer. The picture below shows the report page template with the location of bands.
|
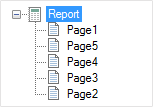
When rendering a report, the report template pages are processed sequentially. The order of page processing is determined by the position of the page in the report tree. The higher the page is in the report tree, the higher is its priority (the sequence) of processing.
For the report tree shown in the picture above, the processing order of the pages will be as follows: the first will be processed Page1, then Page5, Page4, Page3, and finally Page2. Suppose that all the bands are placed on Page1 (see an example of the report template page with the location of bands above). In this case, the bands are processed in several steps:
After the analysis, the report rendering will start. The ReportSummaryBand1 will be processed last.
|

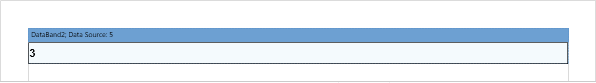
As mentioned above, all bands (except PageHeaderBand1, PageFooterBand1, OverlayBand1, ReportTitleBand1, ReportSummaryBand1) in the report rendering depends on the DataBand1. Consider these relationships in more detail and start with a simple example. The Data Band is placed on the template page.
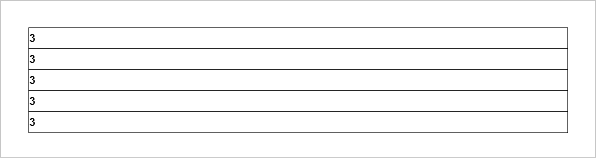
The number of records in the data source is five, and this means that the Data Band is printed 5 times.
Almost all of the bands can be divided into two categories: Headers and Footers, for each header corresponds to the same type of Footers.
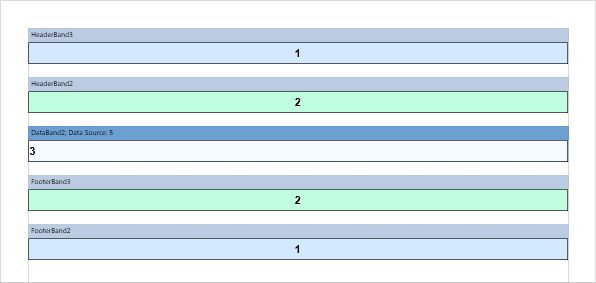
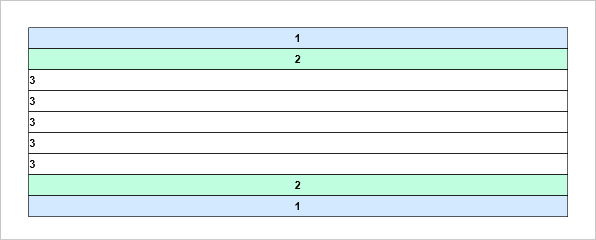
The order of the bands on the page from top to bottom.
In this case, the HeaderBand3 corresponds to FooterBand2, and HeaderBand2 corresponds to FooterBand3. In other words, the first header of the data band corresponds to the footer of the first data band. Here is an example of a rendered report.
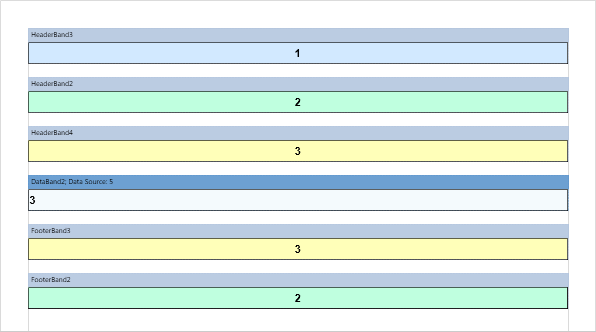
It often happens that the number of headers and footers of a particular type is different. For example, let’s change the example above, adding HeaderBand4 between HeaderBand2 and DataBand2. Now HeaderBand4 corresponds to FooterBand3 (color - yellow), HeaderBand2 - FooterBand2 (color - turquoise), but the band HeaderBand3 (color blue) has no footer.
For the example above, let’s equalize the number of data headers and footers.
In this case, HeaderBand4 corresponds to FooterBand3 (yellow), HeaderBand2 - FooterBand4 (turquoise), HeaderBand3 (blue) - FooterBand2 (zero height). At the same time, FooterBand4 will not be printed (displayed) in the rendered report.
So there is an equal amount of header and footers in the report and it is easy to determine their correspondence. At the same time, you can turn off (do not display) certain bands. All of the examples above were considered for Header Bands and Footer Bands. The same principle applies to Group Header Bands, Group Footer Bands Column Header Bands and Column Footer Bands.
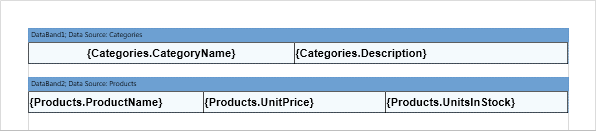
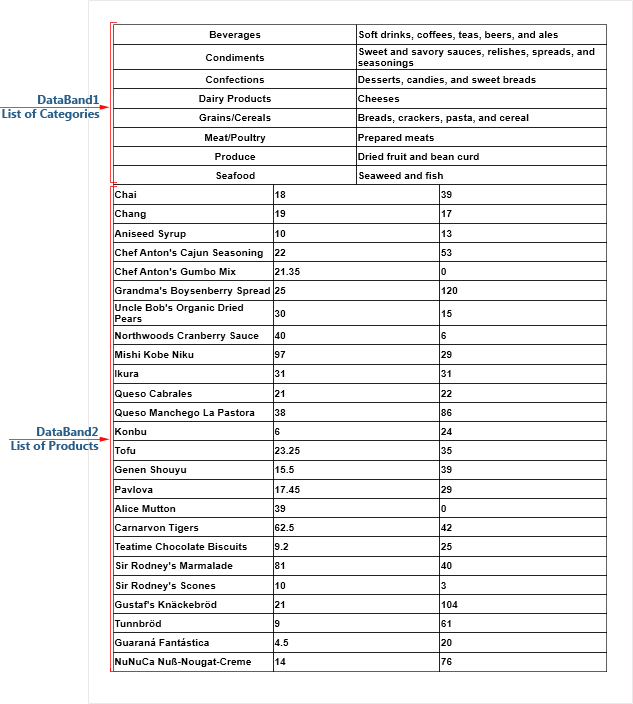
These bands have no connection with each other. Therefore, they are processed sequentially. At first, DataBand1 (category list) will be processed, and then - DataBand2 (list of products).
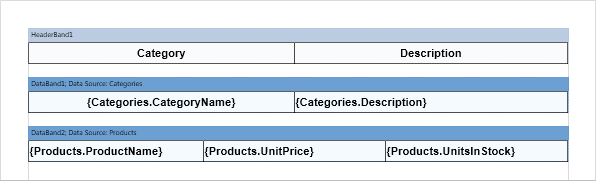
Now add the Header Band to the report template. The Header Band will refer to the Data Band above what it is located. In order the HeaderBand1 corresponds to DataBand1 (list of categories), it must be placed above this data band.
In order HeaderBand2 be related to DataBand2 (list of products), it should be placed directly above this Data Band.
And then the first page of the report will look the following.
Now consider the relationships of footers and multiple data bands. As mentioned above, footers in the report template refers to this data band and only below of which they are directly positioned. At the same time the Footer Band is a closing one to the Header Band. Suppose you want to display the total by the number of categories. In this case FooterBand1 must be placed below the data band with a list of categories but above HeaderBand2 for a list of products.
The report page will look the following way.
To display the total by the data band with a list of products, FooterBand2 must be placed below DataBand2. For this example, let’s calculate the total cost of all the products using the Sum function. The result will be displayed on each page of the report (set the Print on All Pages property to true). Below is a page template with the footer by the data band and the list of products.
And then the first page of the report will look the following way.
The same principle of correspondence applies to Group Header Band, Group Footer Band, Column Header Band, and Column Footer Band.
|