Report without Bands
If it is necessary to display data from only one entry of the data source or data from variables or other data sources that are not lists, the report can be created without the bands. In this case, components are placed directly on a report page.
| 1. | Run the designer; |
2. Connect the data:
2.1. Create a New Connection;
2.2. Create a New Data Source;
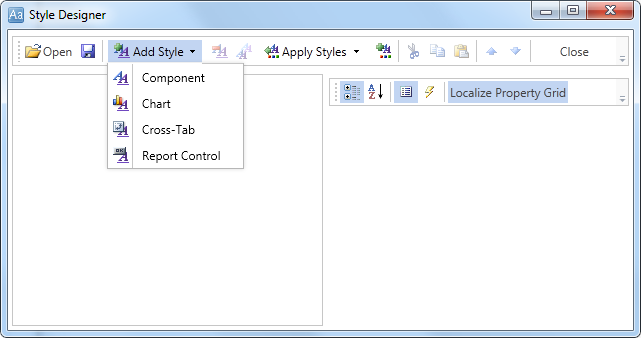
3. Put the Image component with the image on a page;
4. Edit the Image component and an image:
4.1. Drag and drop the Image component on the report page;
4.2. Align the Image component by height and width;
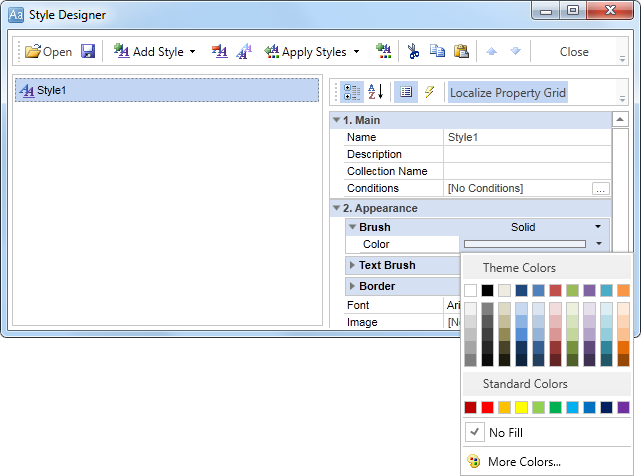
4.3. Set the background color of the Image component;
4.4. Align the image in the component;
4.5. Change values of the properties of the Image component. For example to set the Print property to true, if you want this component be printed;
4.6. If necessary, set Borders of the Image component;
4.7. Set the border color.

5. Put TextBoxes with the text on a page. In this report, put 15 Text components. The TextBox1 contains the {Time} system variable, which will display the current time and date. 2-8 TextBoxes contain the row names in the address box, and 9-15 TextBoxes will include links to data sources;
6. Edit text and text components:
6.1. Drag and drop the text component in the band;
6.2. Change font options: size, type, color;
6.3. Align text component by height and width;
6.4. Change the background of the text component;
6.5. Align text in the text component;
6.6. Change values of text component properties, if required;
6.7. Enable Borders of the text component, if required;
6.8. Set the border color.
7. Click the Preview button or invoke the Viewer, clicking the Preview menu item:
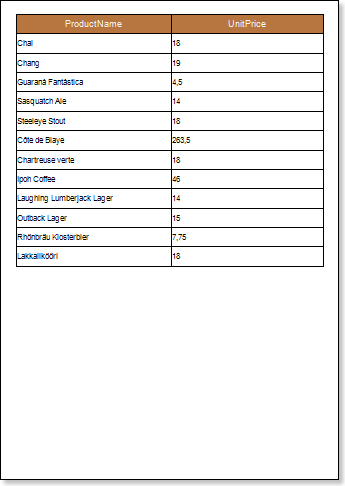
8. Go back to the report template;
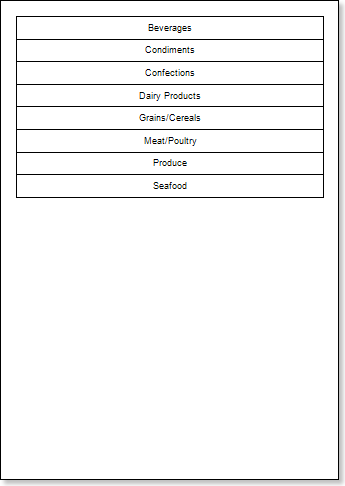
9. Disable Borders of all components. Enable bottom borders for 9-15 TextBoxes:
10. Click the Preview button or invoke the Viewer, clicking the Preview menu item.