Report with Empty Band
The EmptyBand is used to fill free space at the bottom of a page. This tutorial describes how to create a report with the EmptyBand:
1. Run the designer;
2. Connect the data:
2.1. Create a New Connection;
2.2. Create a New Data Source;
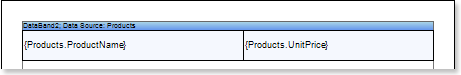
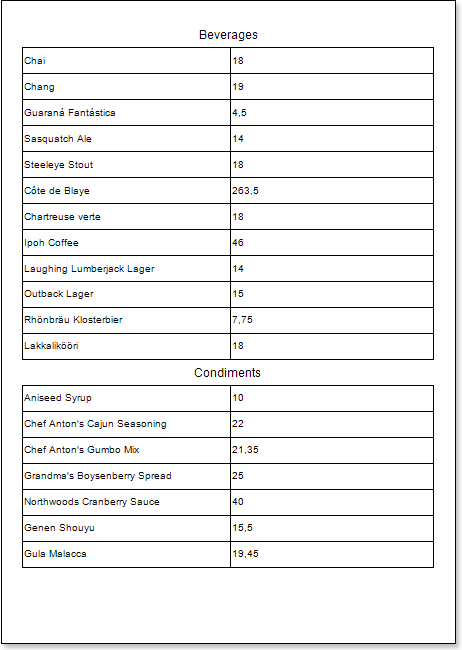
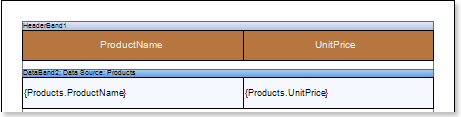
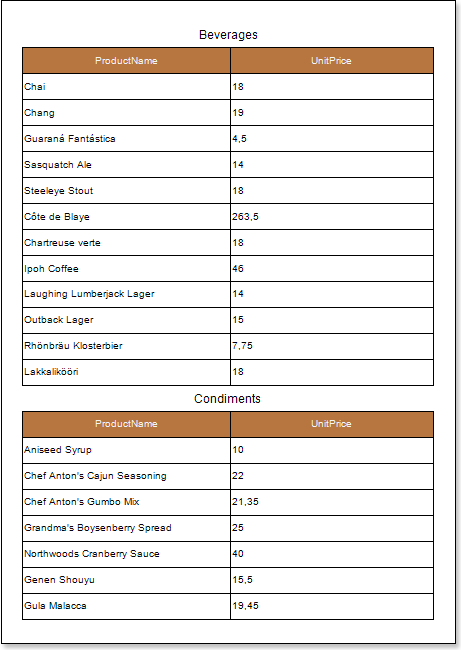
3. Design a report or load a previously saved one. Consider creating a report with the EmptyBand on the base of the Master-Detail report. Suppose there is a Master-Detail report in which data is printed on half of a page, then to fill the empty space you can use the EmptyBand. The picture below shows the rendered Master-Detail report:
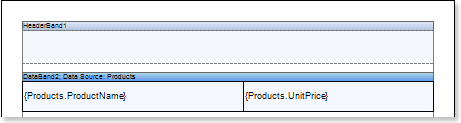
4. Go back to the Master-Detail report template.
5. Add the EmptyBand in the report template;
6. Edit the EmptyBand:
6.1. Align it by height;
6.2. Change the value of required properties. For example, set the CanGrow property to true, if you want the band be grown;
6.3. Set the background color of the EmptyBand;
6.4. If necessary, set Borders of the EmptyBand);
7. Put text components with an expression in the EmptyBand. Where the expression is a reference to the data field. For example, put a text component with the expression: {Line};
8. Edit Text and TextBox component:
8.1. Drag and drop the text component in the EmptyBand;
8.2. Change parameters of the text font: size, type, color;
8.3. Align the text component by width and height;
8.4. Change the background of the text component;
8.5. Align text in the text component;
8.6. Change the value of properties of the text component. For example, set the WordWrap property to true, if you need a text to be wrapped;
8.7. Enable Borders for the text component, if required.
8.8. Change the border color.
9. Click the Preview button or invoke the Viewer, pressing the Preview menu item. The picture below shows a sample of the report:
As can be seen in the picture above blank lines will be numbered and output in the report.
Adding styles
| 1. | Go back to the report template; |
| 2. | Select the DataBand; |
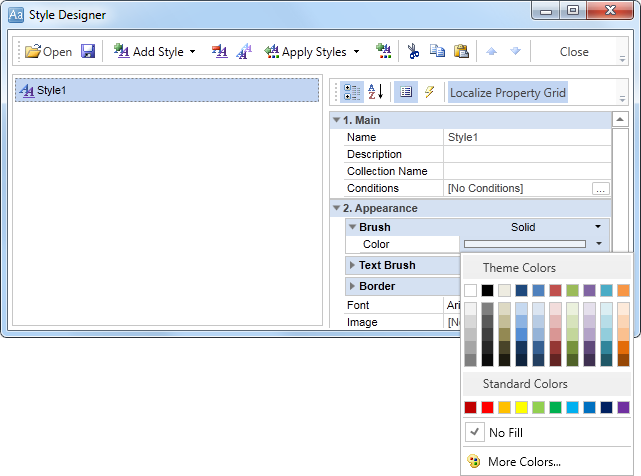
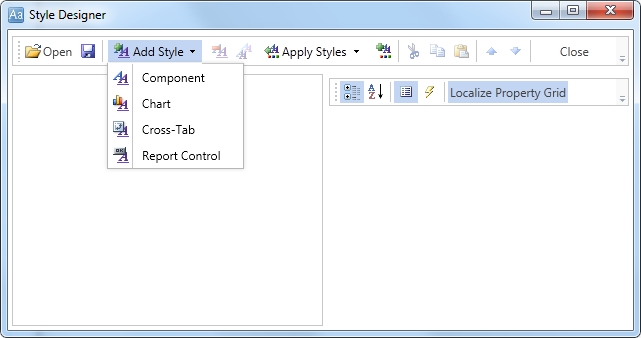
| 3. | Change values of Even style and Odd style properties. If values of these properties are not set, then select the Edit Styles in the list of values of these properties and, using Style Designer, create a new style. The picture below shows the Style Designer. |
Click the Add Style button to start creating a style. Select Component from the drop down list. Set the Brush.Color property to change the background color of a row. The picture below shows a sample of the Style Designer with the list of values of the Brush.Color property:
Click Close. Then a new value in the list of Even style and Odd style properties (a style of a list of odd and even rows) will appear.
5. To render the report, click the Preview button or invoke the Viewer, clicking the Preview menu item. The picture below shows a sample of a rendered report: