Report with Table Component
Do the following steps to design a report with the Table component:
1. Run the designer;
2. Connect the data:
2.1. Create a New Connection;
2.2. Create a New Data Source;
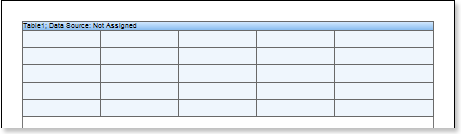
3. Put a Table component on a page of a report template.

4. Edit the Table component:
4.1. Set the amount of columns and rows using, for example, the RowCount and ColumnCount properties. Set these properties to 5 and 3 respectively;
4.2. Set the number of headers and footers in the table using, for example, the HeaderRowsCount and FooterRowsCount properties. Set the HeaderRowsCount property to 1;
4.3. Align the Table component by height;
4.4. Change values of the component. for example, set the CanBreak property to true, if it is required for the Table component be broken;
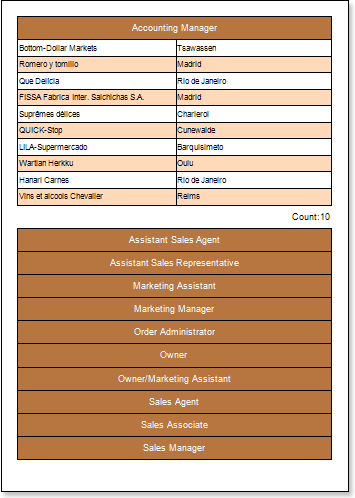
5. Set the data source of the Table component using the Data Source property:
![]()
6. Put some text and expressions in the table cells. For example, cells of the first and third rows will contain only text, that will be a data header. Cells of the second and fourth rows will contain expressions, references to data source;
7. Edit text and cells:
7.1. Set font parameters of text: size, style, color;
7.2. Set color of table cells;
7.3. Align text in cells;
7.4. Change values of cells. For example, set the WordWrap property to true, if it is necessary for the text to be wrapped.
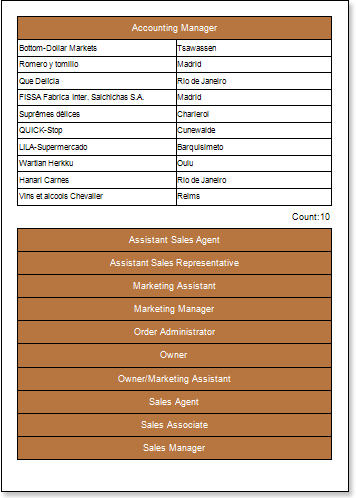
8. Click the Preview button or invoke the Viewer, clicking the Preview menu item. After rendering all references to data fields will be changed on data form specified fields. Data will be output in consecutive order from the database that was defined for this report. The amount of copies of the Table in the rendered report will be the same as the amount of data rows in the database.
Adding Styles
| 1. | Go back to the report template; |
| 2. | Select the Table component; |
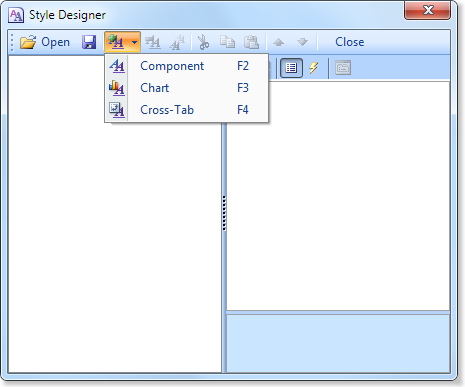
| 3. | Change values of Even style and Odd style properties. If values of these properties are not set, then select the Edit Styles in the list of values of these properties and, using Style Designer, create a new style. The picture below shows the Style Designer: |
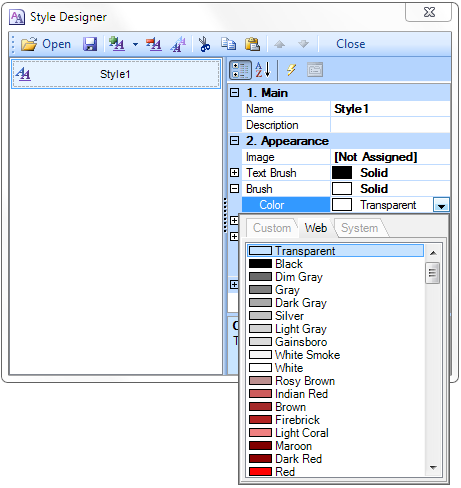
Click the Add Style button to start creating a style. Select Component from the drop down list. Set the Brush.Color property to change the background color of a row. The picture below shows a sample of the Style Designer with the list of values of the Brush.Color property:
Click Close. Then a new value in the list of Even style and Odd style properties (a style of a list of odd and even rows) will appear.
4. To render the report, click the Preview button or invoke the Viewer, clicking the Preview menu item.