Report with Primitives on Page
Primitives are: Horizontal Line, Vertical Line, Rectangle and Rounded Rectangle. Besides, you may use the Shape component. When placing a primitive on a page, the primitive will be rendered as a page item. To design a report with primitives on a page, follow the steps below:
1. Run the designer;
2. Connect the data:
2.1. Create a New Connection;
2.2. Create a New Data Source;
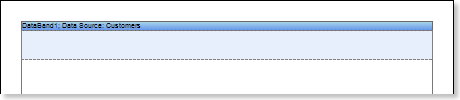
3. Put the DataBand on a page of a report template.
4. Edit DataBand:
4.1. Align the DataBand by height;
4.2. Change values of band properties. For example, set the Can Shrink property to true, if you wish the data band to be broken;
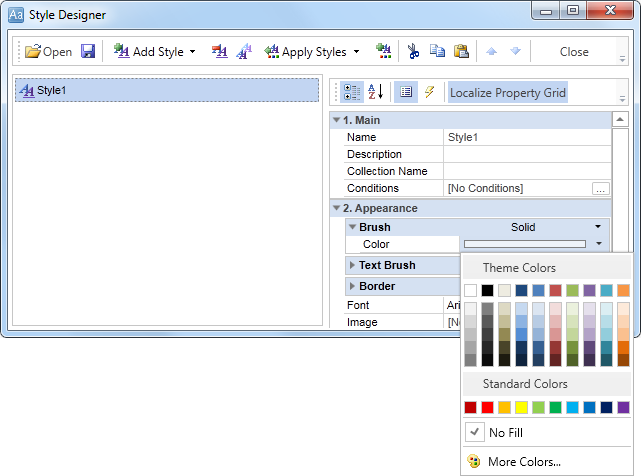
4.3. Change the DataBand background;
4.4. Enable Borders for the DataBand, if required;
4.5. Change the border color.
5. Define the data source for the DataBand using the Data Source property:
![]()
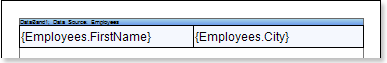
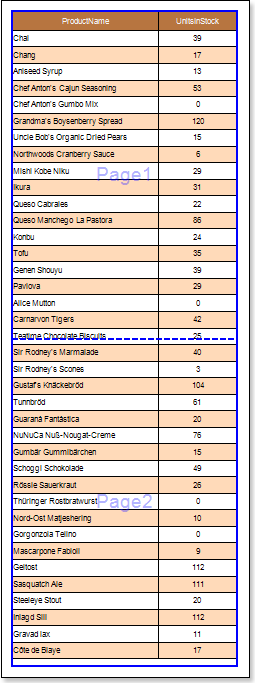
6. Put text components with expressions on the DataBand. Where expression is a reference to the data field. For example, put two text components with expressions: {Employees.FirstName} and {Employees.City};
7. Edit Text and TextBox component:
7.1. Drag and drop the text component in the DataBand;
7.2. Change parameters of the text font: size, type, color;
7.3. Align the text component by width and height;
7.4. Change the background of the text component;
7.5. Align text in the text component;
7.6. Change the value of properties of the text component. For example, set the Word Wrap property to true, if you need a text to be wrapped;
7.7. Enable Borders for the text component, if required.
7.8. Change the border color.
8. Click the Preview button or invoke the Viewer, clicking the Preview menu item.
9. Go back to the report template.
10. Add the Shape component to a report template and edit it:
10.1. Drag and drop the Shape component on the page;
10.2. Change the type of a shape using the Shape Type property. Set the Shape Type property to Complex Arrow;
10.3. Stretch the Shape component horizontally and vertically;
10.4. Change the value of other properties. For example, set the Grow to Height property to true.
The picture below shows a report template with the Shape component placed on the report page:
11. Click the Preview button or invoke the Viewer, clicking the Preview menu item.
12. Go back to the report template.
13. If needed, add other bands to the report template, for example, HeaderBand;
14. Edit this bands:
14.1. Align it by height;
14.2. Change values of properties, if required;
14.3. Change the background color of the band;
14.4. Enable Borders, if required;
14.5. Set the border color.
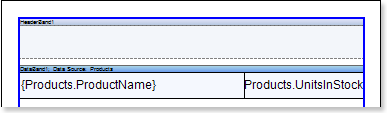
The picture below shows a report template with a HeaderBand:
15. Put text components with expressions in the this band. The expression in the text component is a header in the HeaderBand.
16. Edit text and text components:
16.1. Drag and drop the text component in the band;
16.2. Change font options: size, type, color;
16.3. Align text component by height and width;
16.4. Change the background of the text component;
16.5. Align text in the text component;
16.6. Change values of text component properties, if required;
16.7. Enable Borders of the text component, if required;
16.8. Set the border color.

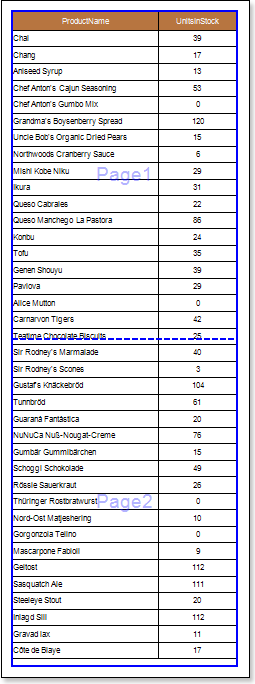
17. Click the Preview button or invoke the Viewer, clicking the Preview menu item. After rendering all references to data fields will be changed on data form specified fields. Data will be output in consecutive order from the database that was defined for this report. The amount of copies of the DataBand in the rendered report will be the same as the amount of data rows in the database.