Report with Cross-Tab on Page
Do the following steps to create a report with the cross table:
| 1. | Run the designer; |
| 2. | Connect data: |
2.1. Create New Connection;
2.2. Create New Data Source;
3. Put the Cross-Tab component on a page of the report template.
4. Edit the Cross-Tab component:
4.1. For example, set the GrowToHeight property to true, to allow the Cross-Tab component to grow by height;
5. Define the data source for the Cross-Tab component of the band, for example, using the Data Source property:
![]()
6. Invoke the Cross-Tab Designer, for example, clicking the Design... item of the context menu of the cross table component. The picture below shows the Cross-Tab Designer window:
![]() The DataSource field shows the data columns of the selected data source;
The DataSource field shows the data columns of the selected data source;
![]() The Columns field shows a list of columns of the data source by what the columns in the cross table will be created;
The Columns field shows a list of columns of the data source by what the columns in the cross table will be created;
![]() The Rows field shows a list of rows of the data source by what the rows in the cross table will be created;
The Rows field shows a list of rows of the data source by what the rows in the cross table will be created;
![]() The Summary field shows a list of columns of the data source by what the summary in the cross table will be created;
The Summary field shows a list of columns of the data source by what the summary in the cross table will be created;
![]() The Properties field shows the properties of the selected item of the cross table;
The Properties field shows the properties of the selected item of the cross table;
![]() The Cross-Tab Cells field shows cells of the cross table;
The Cross-Tab Cells field shows cells of the cross table;
![]() The Select Style button. When clicking the drop down list of styles for the cross table appear.
The Select Style button. When clicking the drop down list of styles for the cross table appear.
7. Do the following steps in the Cross-Tab Designer:
7.1. Add the data column from the ![]() DataSource to the
DataSource to the ![]() Columns field of the cross-tab. For example, add the CategoryID data column to the Columns field of the cross-tab. Hence one entry from this data column will correspond to one column in the rendered cross-table, the number of entries in this data column will be equal to the number of columns in the cross-table;
Columns field of the cross-tab. For example, add the CategoryID data column to the Columns field of the cross-tab. Hence one entry from this data column will correspond to one column in the rendered cross-table, the number of entries in this data column will be equal to the number of columns in the cross-table;
7.2. Add a column of the data source from ![]() the DataSource field to
the DataSource field to ![]() the Rows of the cross-table. For example, add the ProductName data column to the Rows field of the cross-table, and then one entry from this data column will correspond to one row in the rendered cross-table, the number of entries in this data column will be equal to the number of rows in the cross-table;
the Rows of the cross-table. For example, add the ProductName data column to the Rows field of the cross-table, and then one entry from this data column will correspond to one row in the rendered cross-table, the number of entries in this data column will be equal to the number of rows in the cross-table;
7.3. Add a data column from ![]() the DataSource field to the
the DataSource field to the ![]() Summary field of the cross-table. For example, add the UnitInStock data column to the Summary field of the cross-table, all entries in this data column will be summary entries in the cross-table;
Summary field of the cross-table. For example, add the UnitInStock data column to the Summary field of the cross-table, all entries in this data column will be summary entries in the cross-table;
8. Press the OK button to save your changes and go back to the report template with cross-table.

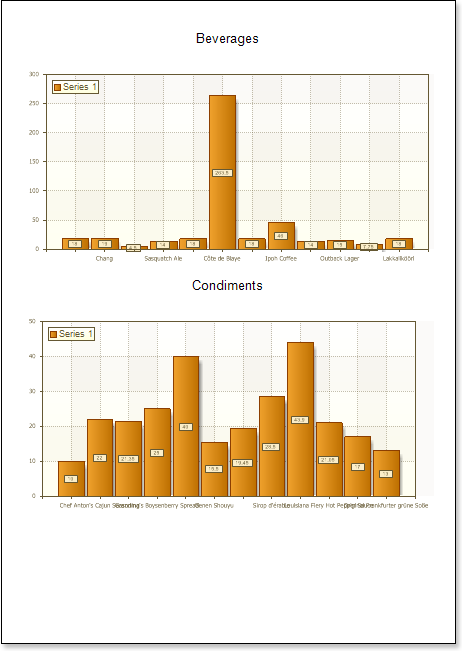
9. Click the Preview button or invoke the Viewer, clicking the Preview menu item. The picture below shows a rendered cross-tab report:

10. Go back to the report template;
11. Edit cells in the report template:
11.1. Set the font settings: type, style, size;
11.2. Set the background of cells;
11.3. Set the Word Wrap property to true if it is necessary to wrap text;
11.4. Switch on/off Borders;
11.5. Set the border color;
11.6. Set the background of cells etc.

12. Click the Preview button or invoke the Viewer, clicking the Preview menu item. The picture below shows a report of the rendered report with the cross table after editing report template cells:

Adding styles
| 1. | Go back to the report template; |
| 2. | Call the Style Designer; |
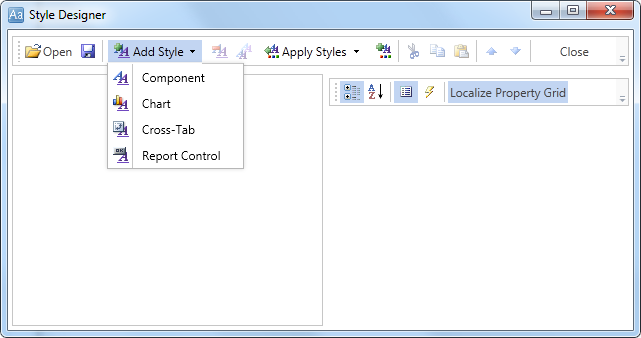
The picture below shows the Style Designer:

Click the Add Style button to start creating a style. Select Cross-Tab from the drop down list. To create the custom style, set the Color property. The picture below shows a sample of the Style Designer with created custom style:

Click Close. In the list of values of the Select Style button in the cross-table editor, a custom style will be displayed. In our case, the name is Style for Cross-Tab. Select this value;
3. Click the Preview button or invoke the Viewer, clicking the Preview menu item. The picture below shows a sample of the rendered cross-table report using the custom style:
